Consider the following to be a meander through the math entrance test results led by a fool who is attracted to the next pretty number or statistic. This document presumes familiarity with the math entrance test.
In short the test is four columns of ten questions in each column. Originally the design intent was to use a score of seven or more in a single column to place a student in the next course. This was found to underplace students, so the following year the cut-off was dropped to six. A study of standard deviations showed that this was statistically significantly separated from random.
The following year unusual score sequences such as "2-2-6-2" began appearing from one state. An additional rule was crafted that the highest column with a score of six or better places the student provided no prior column is less than 5. The resulting OpenOffice.org Calc placement function is:
=IF(AND(F2>4;G2>4;H2>4;I2>5);101;IF(AND(F2>4;G2>4;H2>5);100;IF(AND(F2>4;G2>5);98;IF(F2>5;95;90))))
| MS090 | MS095 | MS098 | MS100 | |
|---|---|---|---|---|
| sample size | 1621 | 1621 | 1621 | 1621 |
| mean | 4.00 | 3.25 | 3.08 | 2.25 |
| stdev | 2.33 | 2.22 | 1.95 | 1.40 |
| coefficient of variation | 0.58 | 0.68 | 0.63 | 0.62 |
Bearing in mind that two is random, the results slide towards randomness as one progresses through the columns. Note that column one, the MS 090 level material, had one problem (number ten) that had no answer. Thus a score of nine was the maximum possible in that column.
The following table shows raw distribution of students into courses by state.
| Placement | Chuuk | Kosrae | Pohnpei | Yap | Total Result |
|---|---|---|---|---|---|
| MS 090 | 560 | 83 | 368 | 163 | 1174 |
| MS 095 | 19 | 39 | 91 | 40 | 189 |
| MS 098 | 15 | 27 | 60 | 17 | 119 |
| MS 100 | 21 | 33 | 61 | 6 | 121 |
| MS 101 or 150 | 4 | 11 | 3 | 0 | 18 |
| Total Result | 619 | 193 | 583 | 226 | 1621 |
The four MS 101 placements from Chuuk are three from Xavier and one from Saramen Chuuk Academy. Placements by high school are further below.
| Chuuk | Kosrae | Pohnpei | Yap | Total Result | |
|---|---|---|---|---|---|
| MS 090 | 0.90 | 0.43 | 0.63 | 0.72 | 0.72 |
| MS 095 | 0.03 | 0.20 | 0.16 | 0.18 | 0.12 |
| MS 098 | 0.02 | 0.14 | 0.10 | 0.08 | 0.07 |
| MS 100 | 0.03 | 0.17 | 0.10 | 0.03 | 0.07 |
| MS 101 or 150 | 0.01 | 0.06 | 0.01 | 0.00 | 0.01 |
| 1.00 | 1.00 | 1.00 | 1.00 | 1.00 |
Bearing in mind that many of the MS 090 placements are actually students in certificate or possibly the proposed new non-admitted category, determining the distribution of students at the national campus is usually best ascertained by looking at the ratios with the MS 090 placements removed.
| Placement | Frequency | Relative Frequency |
|---|---|---|
| MS 095 | 189 | 0.42 |
| MS 098 | 119 | 0.27 |
| MS 100 | 121 | 0.27 |
| MS 101 or 150 | 18 | 0.04 |
| Total Result | 447 | 1.00 |
The above results suggest - only suggest - that we might expect slightly higher numbers of students headed into MS 095 than in the past.
The distribution of students by high school is always of interest, it helps explain the distribution by state table above.
| High School | 90 | 95 | 98 | 100 | 101 | Total Result |
|---|---|---|---|---|---|---|
| Berea CHS | 14 | 2 | 1 | 3 | 20 | |
| CCA | 5 | 2 | 8 | 15 | ||
| CHS | 217 | 2 | 2 | 1 | 222 | |
| CSC | 36 | 4 | 40 | |||
| CSDA | 9 | 1 | 10 | |||
| KHS | 83 | 39 | 27 | 33 | 11 | 193 |
| Mizpah | 14 | 14 | ||||
| NICHS Woleai | 32 | 8 | 1 | 41 | ||
| Ohwa | 5 | 1 | 1 | 7 | ||
| OIHS | 28 | 3 | 31 | |||
| Other | 1 | 2 | 3 | |||
| PATS | 2 | 3 | 6 | 11 | 22 | |
| Pentecostal Light House | 50 | 2 | 52 | |||
| PICS | 342 | 84 | 47 | 31 | 1 | 505 |
| PSDA | 14 | 3 | 4 | 11 | 2 | 34 |
| Saramen CA | 34 | 4 | 3 | 5 | 1 | 47 |
| SNHS | 67 | 2 | 69 | |||
| Weno HS | 116 | 1 | 1 | 118 | ||
| XHS | 2 | 1 | 8 | 10 | 3 | 24 |
| YHS | 77 | 23 | 14 | 5 | 119 | |
| YSC | 26 | 6 | 2 | 1 | 35 | |
| Total Result | 1174 | 189 | 119 | 121 | 18 | 1621 |
The performance by KHS stands out. As one looks over these numbers, bear in mind that this group includes the Gear Up cohort, many of whom also became Upward Bound students. These students have had programmatic intervention with summer courses and after-school/evening tutoring since sixth or seventh grade. Although the change in principal ships was only this current year, this too may have had an impact.
The category "other" refers to three students listed as having a high termed "other".
A rank order can be generated by calculating the average placement for each high school. Xavier tops the list of all schools. Of note is that Berea edged out Saramen in Chuuk, this represents a change from past performance rankings for these two schools. KHS tops the list of public high schools.
| High School | Avg Placement |
|---|---|
| Xavier HS | 98.42 |
| PATS | 97.86 |
| Calvary Christian | 96.40 |
| PSDA | 95.26 |
| KHS | 94.47 |
| Berea CHS | 92.40 |
| YHS | 92.33 |
| Saramen CA | 92.23 |
| PICS | 92.21 |
| Ohwa | 91.86 |
| YSC | 91.60 |
| NICHS Woleai | 91.17 |
| CSC | 90.50 |
| CSDA | 90.50 |
| OIHS | 90.48 |
| Pentecostal Light House | 90.19 |
| CHS | 90.16 |
| SNHS | 90.14 |
| Weno HS | 90.11 |
| Mizpah | 90.00 |
| Total Result | 92.04 |
A similar order can be obtained by calculating the percent who have placed into college level mathematics
| High School | Dev Math | College level |
|---|---|---|
| XHS | 0.46 | 0.54 |
| CCA | 0.47 | 0.53 |
| PATS | 0.50 | 0.50 |
| PSDA | 0.62 | 0.38 |
| KHS | 0.77 | 0.23 |
| Berea CHS | 0.85 | 0.15 |
| Saramen CA | 0.87 | 0.13 |
| PICS | 0.94 | 0.06 |
| YHS | 0.96 | 0.04 |
| YSC | 0.97 | 0.03 |
| CHS | 1 | 0 |
| Ohwa | 1 | 0 |
| CSC | 1 | 0 |
| Weno HS | 1 | 0 |
| OIHS | 1 | 0 |
| NICHS Woleai | 1 | 0 |
| Mizpah | 1 | 0 |
| Pentecostal Light House | 1 | 0 |
| SNHS | 1 | 0 |
| CSDA | 1 | 0 |
| Total Result | 0.91 | 0.09 |
PATS is often perceived as a technical school, but on an academic math examination half of the students are performing at a level that has them ready for college algebra. This is tremendous and renders more poignant the loss of this superb school.
Among the public schools the performance of KHS is notable, placing almost six times as many students into college level mathematics as PICS, the next public school on the list.
The overall result is that 91% of the students place into developmental mathematics. That is part of the big picture: the vast bulk of the students are placing into our lowest level developmental mathematics class.
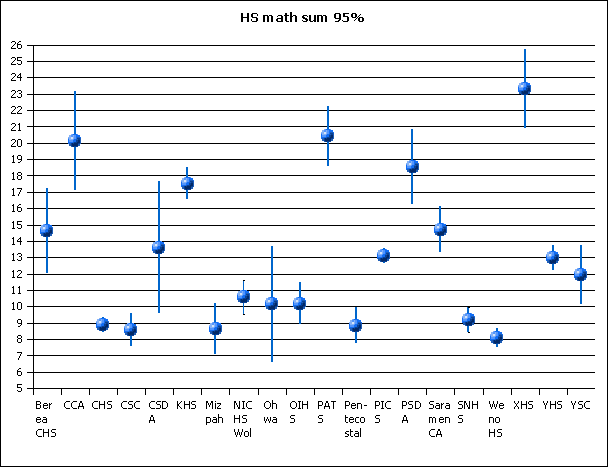
I suppose this section is more of a statistical lark because the sum of the four columns does not have a placement meaning. The sum does represent the number correct out of 40 and as such should reveal relative levels of performance. Striking averages by high school and then calculating the 95% confidence interval for that average yields the following chart:

In the above chart, where a vertical bar for one high school overlaps the average for another, the means are not statistically significant in their separation. For example, the KHS mean is not statistically significantly different than the Pohnpei SDA mean. The XHS mean, however, is statistically significantly different than the KHS mean.
Bearing in mind that random is eight, Chuuk state campus, Mizpah, Ohwa, Pentecostal Lighthouse Academy, and Weno High school are statistically indistguishable from random. As I have said in previous years: release those math faculty, cancel all math classes, teach the students to color in one oval per question. Put any salary money saved towards improving English language skills. Maybe that is harsh. And Ohwa could argue that their small sample size led to a large confidence interval, but an average that is only two more correct than random is still abyssmal. And Weno high school has an average that is random.
Data for the above table:
| High School | Sample Size | Mean | Stdev | Left | Right | Mean |
|---|---|---|---|---|---|---|
| Berea CHS | 20 | 14.65 | 5.55 | 12.05 | 17.25 | 14.65 |
| CCA | 15 | 20.13 | 5.49 | 17.09 | 23.17 | 20.13 |
| CHS | 222 | 8.88 | 3.41 | 8.43 | 9.33 | 8.88 |
| CSC | 40 | 8.58 | 3.21 | 7.55 | 9.60 | 8.58 |
| CSDA | 10 | 13.60 | 5.64 | 9.56 | 17.64 | 13.60 |
| KHS | 193 | 17.52 | 6.93 | 16.54 | 18.50 | 17.52 |
| Mizpah | 14 | 8.64 | 2.68 | 7.10 | 10.19 | 8.64 |
| NICHS Woleai | 41 | 10.59 | 3.33 | 9.53 | 11.64 | 10.59 |
| Ohwa | 7 | 10.14 | 3.80 | 6.62 | 13.66 | 10.14 |
| OIHS | 31 | 10.19 | 3.53 | 8.90 | 11.49 | 10.19 |
| PATS | 22 | 20.41 | 4.08 | 18.60 | 22.22 | 20.41 |
| Pentecostal Light House | 52 | 8.85 | 3.91 | 7.76 | 9.93 | 8.85 |
| PICS | 505 | 13.1 | 5.39 | 12.62 | 13.57 | 13.1 |
| PSDA | 34 | 18.56 | 6.57 | 16.27 | 20.85 | 18.56 |
| Saramen CA | 47 | 14.7 | 4.80 | 13.29 | 16.11 | 14.70 |
| SNHS | 69 | 9.19 | 3.27 | 8.40 | 9.97 | 9.19 |
| Weno HS | 118 | 8.09 | 3.11 | 7.53 | 8.66 | 8.09 |
| XHS | 24 | 23.33 | 5.69 | 20.93 | 25.74 | 23.33 |
| YHS | 119 | 12.98 | 4.31 | 12.20 | 13.77 | 12.98 |
| YSC | 35 | 11.94 | 5.21 | 10.15 | 13.73 | 11.94 |
| Overall: | 1621 | 12.57 | 6.02 | 12.28 | 12.87 | 12.57 |
Kosrae High School ran a math program for "Advanced Students". If those students are looked at separately, they perform statistically indistinguishably from Xavier students:
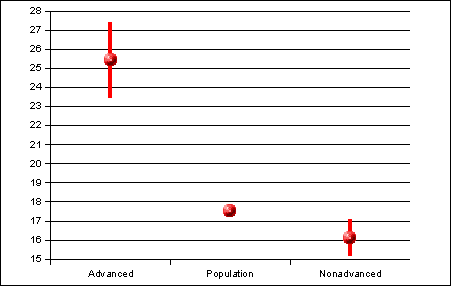
The Advanced Students at KHS are arguably the top math students in the FSM this year.
Count
Adv     KHS
N       164
Y        29
Total  	193

Average
Adv   KHS
N     16.12
Y     25.41
Total 17.52

StDev
Adv   KHS
N     6.22
Y     5.30
Total 6.93
Subsequent to the above work I obtained lists of Upward Bound, Gear Up, and a list of all 31 advanced class students. The following chart presents the 95% confidence intervals for these various groups on Kosrae.
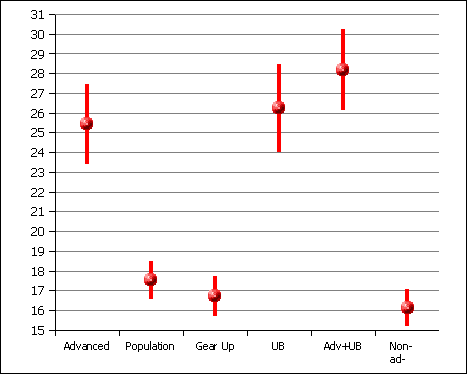
The simple upshot is that too many of the advanced students are also Upward Bound students (16 of 31 advanced students) to ever determine any differential effect. The two averages are hopelessly entangled together.
Bear in mind that this group of 16 were also Gear Up students prior to tenth grade, so Gear Up is also a contributing factor to their success. Of those 16, 14 placed into MS 100 or MS 101. This is an extraordinarily strong performance. Of the 24 UB students, 19 placed into college level mathematics. Of 31 advanced class students, 18 placed into college level mathematics. Of 147 Gear Up students, 25 placed into college level mathematics.
The one result above that might seem odd is that the Gear Up average is numerically lower than the overall high school average, although the difference is not statistically significant. This might seem puzzling, but I show only one student as being in both programs. Bear in mind Gear Up consists of 147 students out of the 193 who took the math test. Basically, Gear Up is everyone not in UB. The UB students performed above average, so when you pull them out, the resulting group has to have an average that is below the overall average.
Ultimately I hold to my metaphor. A canoe called the Kosrae seniors did well on the mathematics entrance/placement test. In the canoe were many paddlers including Gear Up, Upward Bound, the advanced class, the teachers, the parents, the state leadership, and the community. All have contributed to the effort that led to these results. As the Governor noted, the key phrase might be that we should strive to continue to improve.
I had a look at the relative performance of the UB students from the Yap. The students come from three schools:
High School   UB   Non-UB Sum
NICHS Woleai   4   37     41
OIHS           5   26     31
YHS            9   110   119
Total Result  18   173   191
The sample sizes for the UB in the individual schools are too small to compare UB groups to each other. I chose to look at overall high school averages, which include the UB students in the rightmost column with the UB and non-UB students in the bottommost row.
High School   UB     Non-UB  Total Result
NICHS Woleai  16.25  9.97    10.59
OIHS          11.6   9.92    10.19
YHS           19.44  12.45   12.98
Total Result  16.56  11.54   12.02
A look at the 95% confidence intervals results in the following chart:
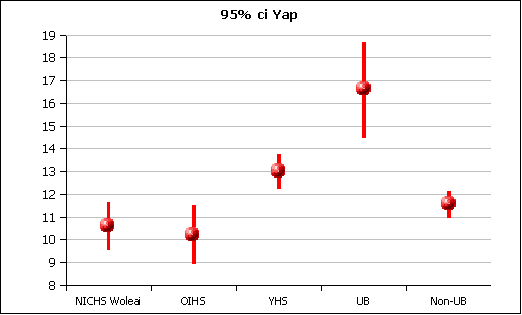
Note that the 95% confidence interval for the UB students does not overlap any of the high school averages. The Yap UB students, as a whole, statistically significantly outperformed the averages at the high schools in Yap.
Of related interest is that Yap high school statistically significantly outperformed NICHS Woleai and OIHS on the math portion of the entrance test.
All errors are mine, and there are some. There are names on some lists which do not appear in the entrance test list, there are entrance test results for names that appear on no list in my possession.
With the names from the spreadsheet provided by Jonathan, I was able to put together a three-state look at Upward Bound performance on the mathematics test. The following chart depicts the 95% confidence interval for the mean sum of the number correct on the mathematics entrance/placement instrument. While the sum has no particular meaning in terms of placement, it is an indicator of overall relative mathematical strength.
The chart depicts both the mean for the UB students and the mean for their high school. Comparison to the high school is necessary because a program such as UB can only lift students relative to the overall performance capability of the high school. The Yap UB numbers, when broken out by high school, create small sample sizes that are statistically problematic. Thus the Yap UB group is considered as a whole.
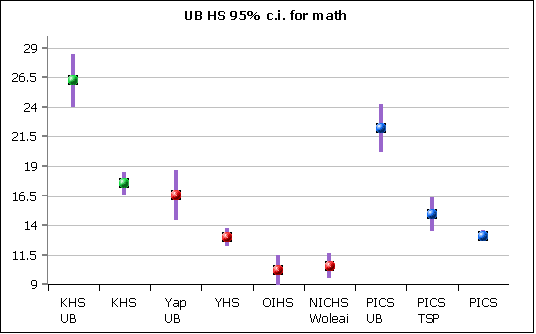
The "balls" are located at the mean, the vertical lines depict the extent of the 95% confidence interval. While there is a maximum possible of 40, ten of those 40 represent MS 100 level material. In some sense, an expected maximum score might be 30 and a score of 21 or better is a reasonably strong performance.
PICS produced the largest "lift" in rank order of 9.14 points, although this is statistically indistinguishable from the 8.73 point difference seen between the KHS UB students and the KHS mean. The Yap students are more complex, but the net boost above the YHS average was 3.57 points.
The separation of the UB students from their HS averages is statistically significant.
Of some passing interest is the note that the KHS overall average is statistically indistinguishable from a Yap UB student. It may be that the elevated overall KHS average is in part creditable to Gear Up.
I remain deeply interested in looking at the A1 section at PICS and running a comparison against the advanced class in Kosrae, but I have not been able to obtain a class list and the pressures of time, work, and space may prevent me from obtaining such a list.
5/4/5 I combined some of the data above into a single chart for purposes of comparison. Note the overall Chuuk state 95% confidence interval calculation excludes Saramen and Xavier as no UB students came from these schools and they are statistically too different from the rest of the schools in Chuuk. This chart depicts the depth of the mathematical weakness of the other schools in Chuuk.
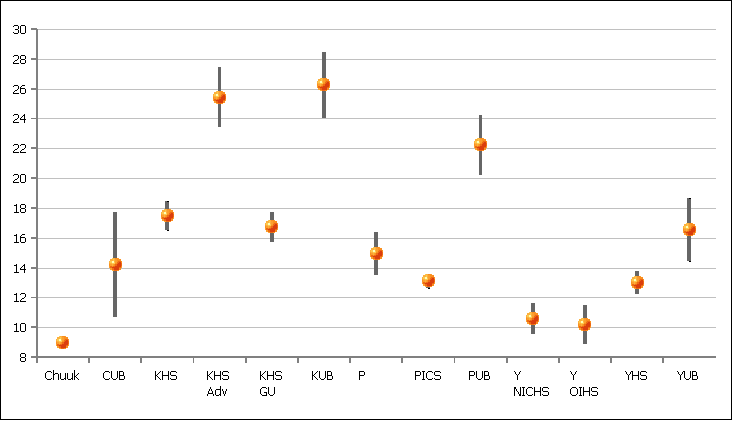
Note that Chuuk UB performs indistinguishably from the general population at PICS or YHS.
The following tables contains data that underlay some of the above charts:
| High School | Low | High | Mean |
| Chuuk | 8.66 | 9.28 | 8.97 |
| Chuuk UB | 10.66 | 17.74 | 14.2 |
| KHS | 16.53 | 18.5 | 17.52 |
| KHS Adv | 23.4 | 27.43 | 25.41 |
| KHS Gear Up | 15.71 | 17.72 | 16.71 |
| Kosrae UB | 24.02 | 28.48 | 26.25 |
| Pohnpei TSP | 13.48 | 16.38 | 14.93 |
| PICS | 12.62 | 13.57 | 13.1 |
| Pohnpei UB | 20.21 | 24.25 | 22.23 |
| Y NICHS | 9.53 | 11.64 | 10.59 |
| Y OIHS | 8.9 | 11.49 | 10.19 |
| YHS | 12.2 | 13.77 | 12.98 |
| Yap UB | 14.44 | 18.68 | 16.56 |
Here is data on other subgroups not included above:
| High School | Low | High | Mean |
|---|---|---|---|
| KHS Advanced | 23.4 | 27.43 | 25.41 |
| KHS | 16.53 | 18.5 | 17.52 |
| KHS Gear Up | 15.71 | 17.72 | 16.71 |
| KHS UB | 24.02 | 28.48 | 26.25 |
| KHS Adv+UB | 26.14 | 30.23 | 28.19 |
| KHS Nonadvanced | 15.16 | 17.08 | 16.12 |
| NICHS Woleai | 9.53 | 11.64 | 10.59 |
| OIHS | 8.9 | 11.49 | 10.19 |
| YHS | 12.2 | 13.77 | 12.98 |
| Yap UB | 14.44 | 18.68 | 16.56 |
| Yap Non-UB | 10.96 | 12.13 | 11.54 |
| PICS | 12.62 | 13.57 | 13.1 |
| PICS UB | 20.21 | 24.25 | 22.23 |
If there are questions, please do not hesitate to ask!