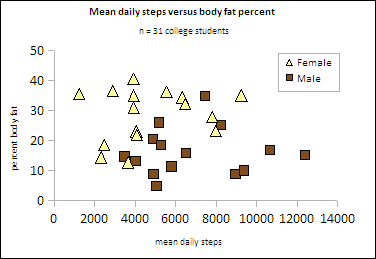
The intent of this study was to examine levels of activity among Pacific island community college students as measured by pedometers. The study also looked for relationships between activity levels and gender, activity levels and body fat percentage, and activity levels versus age.
A convenience sample of college students was studied on Pohnpei to determine activity levels as measured by pedometer step counts. The sample consisted of students in a statistics course at the College of Micronesia-FSM. The students came from all four of the states of the Federated States of Micronesia.
All students in the course had the opportunity to participate in the study, and all received pedometers. Body fat data was not available for every student, and a few students never reported step count data. These students were not considered in the study below. There were no apparent physiological commonalities among the students who did not participate, their absence should not significantly alter nor skew the following results.
Data for the students in the college statistics course included gender, age, height, weight, and percent body fat. The percent body fat was measured using a Tanita ® body composition scale. Complete data was available for 31 students. These 31 students reported daily step counts as measured by World Health Organization pedometers provided by FSM Department of Health. Some students provided as few as four days worth of pedometer data, other students provided over twenty days worth of pedometer data. Overall 539 daily counts were reported by these 31 students.
The mean for these 31 students was 5827 steps per day with a standard deviation of 3869 steps per day.
Gender and mean daily steps
Of the 31 students, 16 students were female. The female students ranged in age from 18 to 26 years old. The female students averaged 4747 steps per day.
Of the 31 students, 15 students were male. The male students ranged in age from 19 to 26 years old. The male students averaged 6815 steps per day. The difference between the average daily steps for females and males was statistically significant (p-value = 0.03).
Body fat and mean daily steps
There was no statistically significant correlation between mean daily step counts and body fat percentage. This lack of correlation held for both females and males.

This study finds no relationship among these 31 students between their level of activity and body fat percentage.
Of the 31 students in the study, seven females measured as being overfat (a body fat percent between 32% and 39%), and one was categorized as being obese (>39% body fat). Three males were measured as being overfat (20% to 25% body fat), and one was categorized as obese (>25% body fat). 12 of the 31 students (39%) are overfat or obese.
With active lifestyles typically categorized as being above a mean of 8000 steps per day, the data suggests that more than one third of this student sample is essentially already an at risk group. Only six students averaged more than 8000 steps per day.
The lack of a correlation might be considered in the following way. Only six students were attaining levels of activity that would be expected to have some impact on body fat levels. The remaining students have levels of activity that would not be expected to impact body fat percent. The students in the study included both students living in the dormitory and those living off-campus. As a whole, the students, whether resident on campus or living off campus, are not significantly active as a group.
Age and mean daily steps
There was a strongly significant negative correlation between age and mean daily steps. Although the age range was small, the results were still significant.
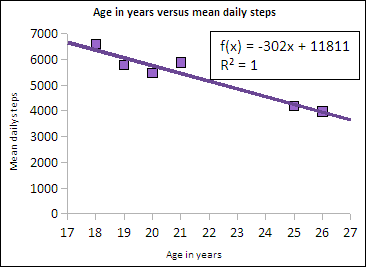
The rate of fall for the students is on the order of three hundred fewer steps per year of age. For each year older, the students lost an average of 300 steps. Given that the sample is active at levels below that of an active lifestyle, and that 39% of the sample is overfat or obese, this decline in activity level with age is of strong concern.
The data is only a small slice of years. The narrow range leaves open the question of what happened prior to 18 years old and what happens after 26 years old. This is an area of ongoing study.
Conclusions
The leading cause of adult death in the FSM are non-communicable lifestyle diseases. The above study, albeit of a small number of students attending college, is cause for concern. Activity levels as measured by pedometers are below those recommended for a healthy lifestyle, activity levels are declining with age, and 39% of the sample is already in a body fat category that places the participant at an elevated risk for non-communicable diseases.
The author would like to thank the students who participated in this study and the FSM Department of Health for their assistance in this study.
The intent of this study was to examine levels of activity for students in second grade classes at different schools as measured by pedometers. The twin goals were to determine whether the second grade students were differently active as measured by pedometers than a previous study of students in a college statistics class. The study also intended to look for differences between a school located in the island's main town and one located outside the main town.
The Seventh Day Adventist school (SDA) is a private school located in Kolonia, the largest town on Pohnpei. Kolonia is effectively the city center. While a few students come into the school from outside of Kolonia, they are the exception. Twenty second grade students at the school participated in the study. The twenty students who were given pedometers and reported back data represented a complete second grade class at the school.
Palikir Elementary School is located about nine kilometers southwest of Kolonia. The students come from the surrounding rural area. Thirty-four students were in the second grade class at the school. Although all thirty-four students were provided with pedometers, only sixteen reported back pedometer data.
The students were asked to report back seven days worth of data. Attempting to run a longer study with subjects as young as second graders appeared to be unrealistic based on pilot run at an anecdotal level.
Student gender and age were also reported. The Palikir sample consisted of nine females and seven males. The SDA sample consisted of nine females and eleven males. The average age for the Palikir sample was 8.56 years old. The average age for the SDA sample was 7.45 years old. This difference was statistically significant (p-value < 0.01).
Mean daily steps for college students and second grade students
The mean for 31 college students enrolled in a statistics course was 5827 steps per day. The mean for all 36 second grade students was 6666 steps per day. This difference was statistically significant (p-value = 0.04). The second grade students were more active than the college students. While this result is consistent with increasing steps per day with decreasing age, the value is lower than that predicted by a linear regression run on the college student data alone.
Of the 31 college students, 16 students were female. The female college students ranged in age from 18 to 26 years old. The female colleges students averaged 4747 steps per day. The female second grade students ranged in age from six to ten years old with a mode of eight. The female second grade students averaged 4497 steps per day.
Of the 31 college students, 15 students were male. The male college students ranged in age from 19 to 26 years old. The male college students averaged 6815 steps per day. The male second grade students ranged in age from seven to eleven years old with a mode of eight. The male second grade students averaged 6997 steps per day.
The female college students were more active than the second grade female students as measured by a pedometer. The opposite was true for the males, with the male second grade students more active than the male college students.
Differences between the schools
The average for the sixteen Palikir Elementary School second grade students was 5123 steps per day. The average for the twenty Seventh Day Adventist second grade students was 6246 steps per day. The standard deviations for both groups were high (2250 steps and 3677steps respectively), as a result the difference in the averages between the two schools was not statistically significant. There is no difference in activity levels between the two sets of second grade students as measured by daily step counts using a pedometer.
Gender differences for the second grade students
Given that the two schools did not perform statistically differently as measured by the daily mean steps, combining the genders for both schools appears to be reasonable. The result for the 18 females is a mean daily step count of 4497 steps. Combining the males for the two schools also results in 18 students. The 18 male students had a mean daily step count of 6997 steps. The difference for these two means was statistically significant (p-value = 0.02).
The male students were more active than the female students. No exploration of possible causes of this difference were attempted in the study. The data does suggest that females may be relatively physically inactive from early in life.
Conclusions
This informal study is limited in its power to generate broad conclusions. The data does suggest, however, that levels of activity are fairly low among second grade students at these two schools.
The gender difference between the male and female second graders is potentially a cause for concern. Females may become differentially more inactive earlier in life than males, leaving them more vulnerable to non-communicable lifestyle diseases earlier in life.
The above two tentative conclusions suggest that putting in place a structured daily physical education or exercise and sport program would be valuable in the schools.
The author would like to thank the students who participated in this study. Special thanks to Karen McVickers and Aimy Manuel for their invaluable assistance and for making their students available to participate in this study. Thanks are also due to the FSM Department of Health for their assistance in this study and the Imi Hale foundation in Hawaii who provided the pedometers for this particular project.
An informal study of activity levels versus age was conducted on Pohnpei in the Federated States of Micronesia between February and June 2008. Existing small convenience samples formed the basis of this informal report. The intent of the report is to gather information that might be useful and informative to further more formal studies.
Between February and April of 2008 students in the MS 150 Statistics class were given pedometers provided by the FSM Department of Health. The students used these pedometers to gather their own daily step count information. Forty students reported their daily step counts. The students reported four to fifty-one days worth of data with an average of 16.78 days worth of data per student. The mean for these forty students was 5467 steps per day. Note that this study has five more students than an earlier report on this sample. The earlier report did not include students who were absent on the days when body composition measurements were taken.
During April 2008 thirty-six second grade students in one class each at two schools were given pedometers provided by the Imi Hale/Pacific Diabetes Education Program in Hawaii. The students reported one to ten days worth of data with an average of 5.11 days worth of data per student. The mean for these thirty-six second grade students was 5747 steps per day.
Students attending the MS 150 Statistics course during June 2008 were given three pedometers. The students were instructed to wear one, give the second to someone at least ten years younger, and give the third to someone at least ten years older. The students reported back data for thirty-seven individuals including themselves. Many of the students chose siblings, other relatives, or friends for the second and third pedometer. The measurements consisted of four to eight days worth of data with an average of 6.62 days worth of data per student. The mean daily steps for these forty-one individuals was 5053 steps per day.
For all of the above samples age data is known. The age of the individuals range from six to sixty years old with an average of 20.08 years old (standard deviation = 13.14).
The mean daily step counts range from 574 steps per day to 16269 steps per day with an average of 5496 steps per day (standard deviation = 2909).
Data Analysis
A scatter plot of the above samples of age versus the individual daily mean steps is seen in illustration one.
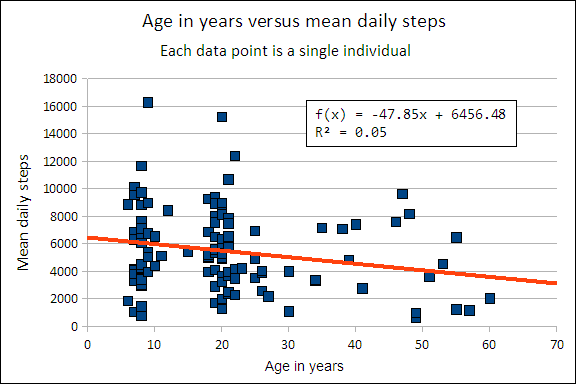
The data shows a downward trend with age. The correlation coefficient r is − 0.22 (p-value, two-tailed = 0.02). Bearing in mind that the samples are convenience samples, the correlation is not random. The data suggests a decline of roughly fifty steps per year. The trend suggests a theoretical starting point of 6456 steps per day for the individuals in these samples.
The two distinct age "clumps" represent the second graders (around seven and eight years old) and the college students (around twenty years old). The bulk of the rest of the data comes from the work of the statistics students in June 2008.
Conclusions
The rate of decline in activity levels as measured by pedometers is small, a drop of fifty steps per year. This is a very modest decline and probably not a cause for concern if the decline were to have started at activity levels above 10,000 steps per day.
The starting point, however, for this downward trend is projected to be 6456 steps per day. An active lifestyle is typically considered to incur 8000 or more mean steps per day. The starting point for the individuals in this study is well below that of an active lifestyle. 82% of the participants have a mean daily step count less than 8000, and the sample is biased towards younger participants in terms of age.
Knowing the issues that Micronesia faces in terms of obesity and obesity-related diseases, the overall low levels of activity across all age groups is a primary finding and principal concern raised by this data.
Secondarily, there is apparently a steady decline in those low mean step counts with age.
This data should be considered a call for a more careful and broader study of activity levels among Micronesians of all ages.
The author would like to thank those who participated in this study and for the support of the college during these studies. Thanks are also due to the FSM Department of Health the 'Imi Hale foundation/Pacific Diabetes Education Program in Hawaii who provided the pedometers for these informal studies. Special thanks are due to Carter Apaisam, Robert Spegal, and Nia Aitaoto.
Although my work with groups has ended, I have continued to track my own daily step numbers. Wear and tear on pedometers has provided some useful, if belated, information.
The clear plastic WHO pedometers have proven remarkably durable and humidity resistant. Their primary failure mode is their hinge. If the pedometer is struck, the circular plastic around the metal hinge pin breaks (the hinge for the belt clip, not the door hinge). The good news is that the hinge is on the door, not the pedometer, and the door can be replaced. Over the past 246 days I have replaced the door four times. This, of course, requires having spare pedometers with intact doors. I have used four that were originally distributed to family members (and who no longer are using them) to replace doors.
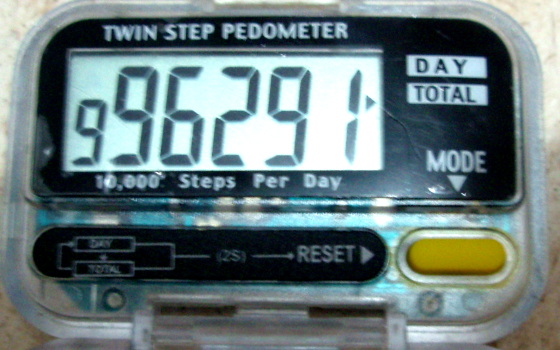
WHO pedometer about to turn a million steps back in August
The green plastic Imi Hale pedometers do have problems with accidental resetting due to the reset button being on an exposed face. The clear plastic WHO pedometer does not have this vulnerability. Unfortunately the pedometer has a number of failure modes beyond hinge damage.
The green plastic Imi Hale pedometer has yet to survive a run of 15 kilometers or more. The pedometer counts the steps accurately - I have run the numbers against a simultaneously worn WHO pedometer and done field counts of my steps. At the end of the run the pedometer displays an accurate count. Within an hour, the display becomes scrambled.
The problem may actually be humidity. I wear the pedometer clipped to my running shorts, with a shirt that is not tucked in. Inside the shirt the humidity is saturating humidity. This has never affected the WHO pedometers, but does apparently affect the green Imi Hale pedometer. Condensed vapor appears inside the green pedometer, but not the clear plastic WHO pedometers. Attempts to sun dry the pedometer do not reverse the damage.
As a result of the above, I tend to "kill" an Imi Hale pedometer once a week with a long run. The pedometer "survives" shorter runs. My hunch is that the clear plastic WHO pedometers are better sealed around the seams and buttons. The WHO buttons are also inside a door, whereas the green Imi Hale pedometer buttons are externally exposed.
The pedometer has been a potent motivator for me personally. The pedometer appears also to have an initially motivating effect on others, but this effect appears to wear off with time. Users appear to gradually lose interest. Anecdotally I know of no participant who continues to use the pedometers distributed last spring and last summer.
Whether a pedometer which lasts longer would be of benefit, given the apparent cessation of use over time, is an open question. Certainly a pedometer can be a useful tool as a part of an active diabetes and health program, especially in the initial phases. The pedometer introduces the client to the idea that they are physically inactive (in the typical case) and that an increase in healthy activity is required.
Studies of weight loss programs have shown the strongest success when diet control was coupled with exercise, programs that focus on dieting along tend to fail on five year and beyond time frames. The pedometer is a useful tool to start someone exercising. The hope would be that with encouragement the exercising might become a habit long after the pedometer fails.
My own solution has been to determine my average number of steps by day of the week (I have a fairly repetitive weekly routine due to classes) and treat that as an estimated base. I run at a very consistent 154 steps per minute (based on data both from the WHO pedometer and field counts of steps that confirm the pedometer data), so I can use my running time plus the base to estimate my daily steps without a pedometer.
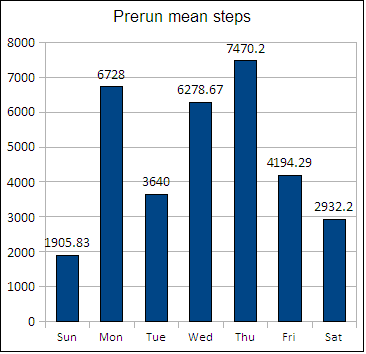
Daily pre-run step count averages
Note that there is no day of the week in which I get more than 7470 steps, so technically I always need to run to bring up my daily count. One result of this is that there is a coupling between the amount of time I spend running each week and the number of steps I average over a seven day period. In the following charge the average number of steps over seven days is the top line, the bottom line is the number of minutes of running summed over a seven day period. Note the vertical axis is logarithmic, being the steps for the upper line and time for the lower line.
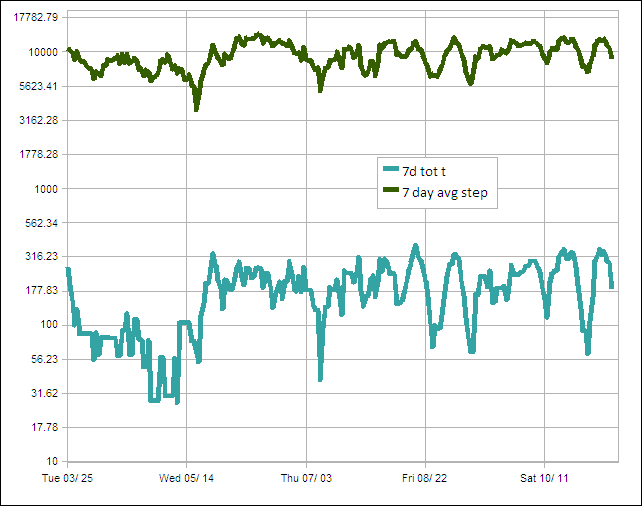
Average steps over a seven day period and the total running time for the same seven day period.
Up until May, with my running down to once a week and less, my cumulative steps average was around 8000 steps (03 March to 13 May 2008). On 14 May 2008 my cumulative average steps fell below 8000. Commencing on 19 May I began to run more regularly and to run for longer distances with a goal of pushing my cumulative average steps above 9000. My sense was that my cumulative average would probably settle down around five to six thousand without any running.
With this commitment to lift my cumulative average above a daily pre-run baseline, running became an important contribution to my cumulative average steps. Starting in May the two lines "track" each other roughly. The behavior suggests that, at least for me, my seven day total running time could be substituted for step counts provided I am running regularly. This may be a useful approach more broadly: minutes of activity would count towards "steps" in some sense. That is, a whole wellness program could conceivably be designed around "intentional exercising movement time" in the absence of pedometers.
If the seven day total running time is plotted against the seven day average steps from 19 May 2008 to 15 November 2008, then there a linear correlation coefficient of 0.82.
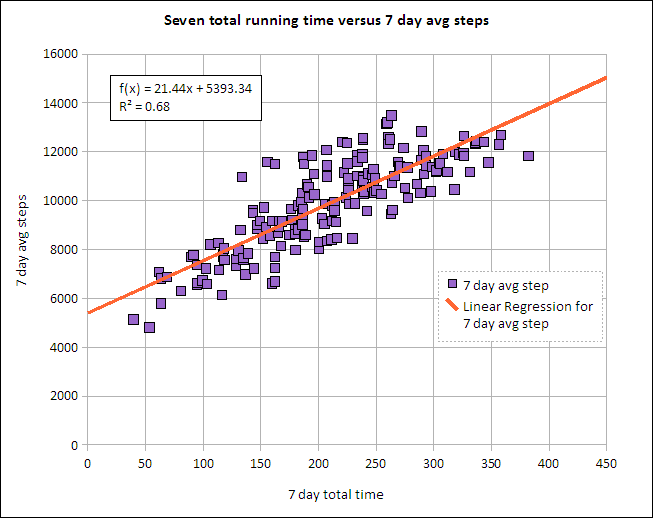
Linear regression of seven day total time versus seven day average daily steps
The strong correlation provides statistical support for the visual parallels seen in the earlier chart.
Dana Lee Ling