Test five is on line in an HTML format with some loss of formatting at:
http://www.comfsm.fm/~dleeling/math/algebra/m61/html/m61q5.html

Sixteen students took test five with an average score of 6.3 out of 19 with a standard deviation of 5.54. The high score was a 17 and the low score was a 0. The item analysis follows, with the number correct shown and the percentage out of 16 given:
T5 Corr Corr/16
1a 5 0.31
1b 3 0.19
1c 5 0.31
1d 5 0.31
2 3 0.19
3 3 0.19
4a 5 0.31
4b 4 0.25
4c 5 0.31
4d 2 0.13

In general, as has been the case throughout the term, students did poorly on this examination. Of note that that questions 4a and 4b involved substitution into formulas which were given. The inability of eleven students to analyze a function, determine the coefficients, and then substitute those coefficients into a formula is, in my mind, an inability in material below the college algebra level.

Also of note was that 2 and 3 asked only for the name of the shape and did not require calculations. Based on the calculations I saw, a number of students simply did not read the question.

4c was somewhat encouraging in that five students had fully correct graphs. Parabolas opening down seem to be somewhat problematic for students, with only three of eighteen students successfully graphing an inverted parabola on test three.

We are now moving into review, with a review quiz on Tuesday which I will go over on Thursday. 

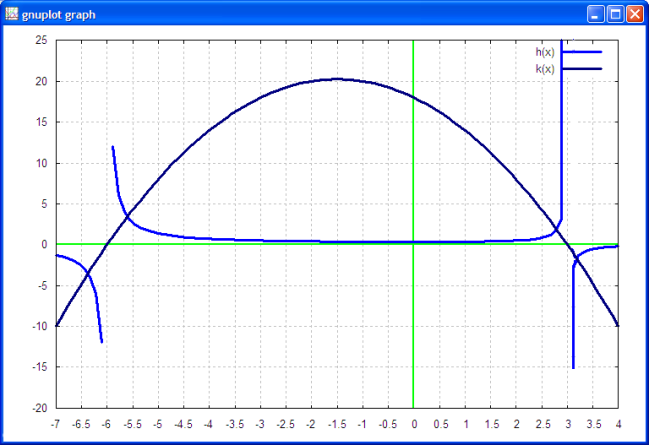
The other day I spoke of the usefulness of Gnuplot, a freely available open source graphing package that should be useful for those MS 100 courses taught in a computer laboratory or where students have their own laptops. The following is an image of the functions in question one and four. The image is tad blurry because I rescaled it using GIMP for purposes of printing for class.
test five

The command sequence for the above is (which I put in a .plt text file and loaded to generate the image):
reset
set border
set xtics 0.5
set ytics 5
set grid
set xzeroaxis lt 2 lw 2
set yzeroaxis lt 2 lw 2
set style line 1 lt 3 lw 3
set style line 2 lt 5 lw 3
set style line 3 lt 12 lw 3
set xrange [-7:4]
set yrange [-20:25]
f(x)=x-6
g(x)=x**2+3*x-18
h(x)=f(x)/g(x)
k(x)=-x**2-3*x+18
plot h(x) ls 1,k(x) ls 2

--

Dana Lee Ling
Professor
Chair Division of Natural Sciences and Mathematics
College of Micronesia-FSM
dleeling@comfsm.fm
http://www.comfsm.fm/~dleeling/

Historically diverse, uniquely Micronesian and globally connected, the College of Micronesia-FSM is a continuously improving and student centered institute of higher education. The college is committed to assisting in the developing of the nation by providing academic, career and technical educational opportunity for learners in the Federated States of Micronesia.

Accredited by the Accrediting Commission for Community and Junior Colleges of the Western Association of Schools and Colleges

Go Sharks!