Volume versus density. Marbles.
Data table
| marble volume (cm³) | Marble mass (g) |
|---|---|
| 0.62 | 1.65 |
| 1.70 | 4.35 |
| 7.42 | 18.60 |
| 21.31 | 53.75 |
| 21.31 | 53.75 |
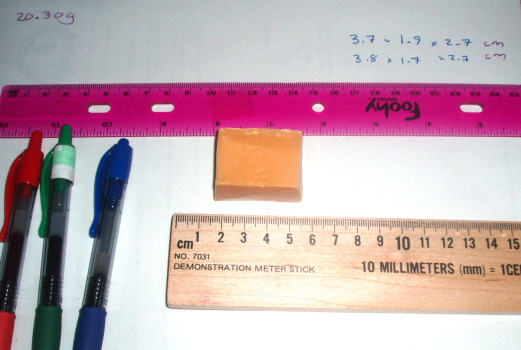
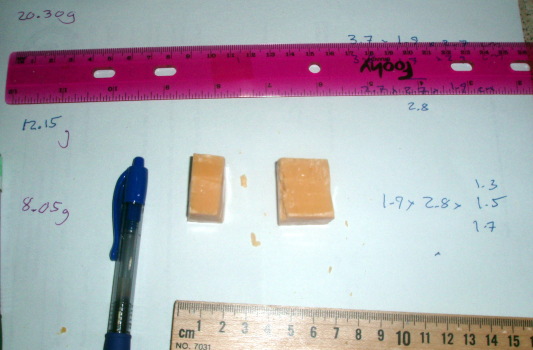
Carved soap experiment.
Data table. The variable volumes are due to ± 0.1 mm in actual measures on different slab faces.
| Soap volume (cm³) | Soap mass (g) |
|---|---|
| 6.9 | 8.1 |
| 8.0 | 8.1 |
| 9.0 | 8.1 |
| 11.3 | 12.2 |
| 11.7 | 12.2 |
| 17.4 | 20.3 |
| 19.0 | 20.3 |
A test of the soap used found that the soap sank in water, as predicted by the density being greater than one.
The initial slab from a half of a bar of GIV soap.

The initial slab was split roughly 2:1, with all cutting being done by hand. That the result was a strong correlation was both a pleasant surprise and an assurance that the system is relatively robust. The slabs were not perfectly squared off, yet the relation held.

Typically used functions in conjunction with regressions
| Linear Regression Functions | |||
|---|---|---|---|
| Statistic or Parameter | Math symbol | Stat symbol | OpenOffice |
| Slope | m | b | =SLOPE(y-data;x-data) |
| Intercept | b | a | =INTERCEPT(y-data;x-data) |
| Correlation | r | =CORREL(y-data;x-data) | |
| Coefficient of Determination | r2 | =(CORREL(y-data;x-data))^2 | |
| Slope for intercept forced equal to zero | =LINEST(y-data;x-data;0) | ||