Use this female adult literacy data to answer the following questions in part I. The
female adult literacy rate is the percentage of adult women who can read.
For this part use the following data. The adult female literacy rate is the
percentage of women that country who can read. The infant mortality rate is the
number of babies per one thousand live births who die before they reach one year in
age. So, for example, in the FSM 88% of the adult women in the country can read and
of 1000 babies born in the FSM in the year 2000, 33 will die before they reach their first
birthday (the infant mortality estimates are for the year 2000). Note that the table
continues across the page break.
| Statistic or Parameter |
Symbol |
Equations |
Excel |
| Square root |
|
|
=SQRT(number) |
| Sample size |
n |
|
=COUNT(data) |
| Minimum |
|
|
=MIN(data) |
| Maximum |
|
|
=MAX(data) |
| Median |
|
|
=MEDIAN(data) |
| Mode |
|
|
=MODE(data) |
| Sample mean |
 |
Sx/n |
=AVERAGE(data) |
| Population mean |
m |
SX/N
x P(x)
n p (binomial) |
=AVERAGE(data) |
| Sample standard deviation |
sx |
 |
=STDEV(data) |
| Population standard deviation |
s |

 (binomial) (binomial) |
=STDEVP(data) |
| Sample variance |
(sx)² |
|
=VAR(data) |
| Population variance |
s² |
|
=VARP(data) |
| Sample Coefficient of Variation |
CV |
100(sx/ ) ) |
=100*STDEV(data)/AVERAGE(data) |
| Slope |
b |
|
=SLOPE(y data, x data) |
| Intercept |
a |
|
=INTERCEPT(y data, x data) |
| Correlation |
r |
|
=CORREL(y data, x data) |
| Coefficient of Determination |
r² |
|
=(CORREL(y data, x data))^2 |
| Binomial probability |
|
nCr pr q(n-r) |
=COMBIN(n,r)*p^r*q^(n-r) |
| Calculate a z value from an x |
z |
=  |
=STANDARDIZE(x, m, s) |
| Calculate an x value from a z |
x |
= s z + m |
= s*z+m |
Calculate a z-statistic from an  value
given m and s value
given m and s |
z |
 |
=STANDARDIZE( , m, s/SQRT(n)) , m, s/SQRT(n)) |
| Calculate a t-statistic or t-ratio or tdata |
t |
 |
=STANDARDIZE( , m,
sx/SQRT(n)) , m,
sx/SQRT(n)) |
| Find a probability p from a z value |
|
|
=NORMSDIST(z) |
| Find a z value from a probability p |
|
|
=NORMSINV(p) |
| Standard error of the population mean |
SE |
 |
|
| Standard error of the sample mean |
SE |
 |
|
| Determining z critical from a for confidence intervals. |
zc |
|
=NORMSINV(1-a/2) |
| Error tolerance E of a mean for n ³ 30 using s |
E |
 |
=CONFIDENCE(a,s,n) |
| Error tolerance E of a mean for n ³ 30 using sx |
E |
 |
=CONFIDENCE(a,sx,n) |
| Error tolerance E of a mean for n < 30. Can also be used for n ³ 30. |
E |
 |
[no Excel function, determine tc and then multiply by standard error of the
mean as shown in the equation] |
| Determining tc from a and the degrees of freedom
df for a confidence interval. |
tc |
|
=TINV(a,df) |
Calculate an  value from a tc,
sx, n, and m value from a tc,
sx, n, and m |
|
 = = + m + m |
|
Calculate a confidence interval for a population mean m from
a sample mean  and an error tolerance E and an error tolerance E |
|
 -E< m
< -E< m
< +E +E |
|
| Determining zc from a for a TWO-tail hypothesis
test. |
=NORMSINV(a/2)
[returns only the negative value for zc] |
| Determining zc from a for a ONE-tail hypothesis
test. |
=NORMSINV(a)
[returns only the negative value for zc] |
| Determining tc from a and degrees of freedom df
for a TWO-tail hypothesis test. |
=TINV(a, df)
[returns only the positive value for tc] |
| Determining tc from a and degrees of freedom df
for a ONE-tail hypothesis test. |
=TINV(2a, df)
[returns only the positive value for tc] |
| Determining the p-value from a z-statistic, ONE tail |
=1-NORMSDIST(ABS(z)) |
| Determining the p-value from a z-statistic, TWO tail |
=2*(1-NORMSDIST(ABS(z))) |
| Determining the p-value from a t-statistic, ONE tail |
=TDIST(ABS(t),df,1) |
| Determining the p-value from a t-statistic, TWO tail |
=TDIST(ABS(t),df,2) |
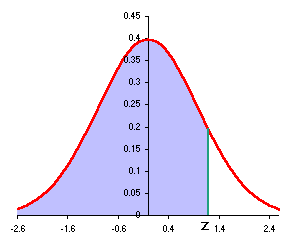
The standard normal Excel functions such as NORMSDIST and NORMSINV use "left"
to z as shown at the right below:

 = 93
= 93 


