Mx: MS 150 Statistics Summer 2001

Probability Distributions and Relative Frequencies

  1. 1213 students took the TOEFL test in the Spring 2001.  The distribution of the 1213 scores is as seen below:
    Class Upper
    Limit x
    Frequency Relative
    Frequency P(x)
    x*P(x) (x - m)²P(x)
    270 1
    _____________
    310 41
    _____________
    350 138
    _____________
    390 189
    _____________
    430 204
    _____________
    470 242
    _____________
    510 188
    _____________
    550 117
    _____________
    590 66
    _____________
    630 19
    _____________
    670 8
    _____________

    Sum:


    ________

    _____________

    ______

    ________

    Sqrt:


    ________
    1. Calculate the relative frequencies P(x) and record the relative frequencies in the table above.
    2. Sketch a relative frequency histogram of the data, labeling your horizontal and vertical axes as appropriate.


    3. What is the shape of the distribution? _____
    4. Calculate the mean for the TOEFL data by summing the x*P(x) values.  You do NOT need to record each x*P(x) value in the table above: use Excel to do your work.  You need only write down the value of the mean that you calculate.

      mean  m = _________________
    5. Calculate the standard deviation for the TOEFL data by calculating probabilitypopstdev.gif (1053 bytes).  You do NOT need to record each (x - m)²P(x) value in the table above: use Excel to do your work.  You need only write down the value of the standard deviation that you calculate.

      standard deviation s =
    6. Determine the probability of a TOEFL score being between 311 and 350, P(311-350) = ______________
    7. Find the mean of the data given.___________
    8. Use the mean and standard deviation from above to calculate a coefficient of variation for the data.

      coeffiecient of variation = _____________
    9. What is the value of n for this data set? _____________
Linear Regression

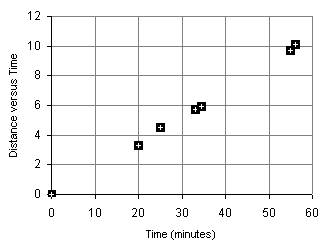
  1. The data and graph is of a runner running from the College campus up to Bailey Olter High School via the back road past the powerplant in Nahnpohnmal.  The x data is the time in minutes, the y data is the distance in kilometers.  Use either your calculator or Excel to perform the calculations.
    Time x (minutes) Distance y (km)
    0 0
    20 3.3
    25 4.5
    33 5.7
    34.5 5.9
    55 9.7
    56 10.1


    distanceversustimeq3.gif (3562 bytes)

    1. Find the mean of the time (x) data.

      mean of the time data = ___________
    2. Find the sample standard deviation for the time (x) data.

      standard deviation of the time data: _________
    3. What is the correlation for the data?
      1. perfect negative correlation
      2. highly negative correlation
      3. moderately negative correlation
      4. no correlation
      5. moderately positive correlation
      6. highly positive correlation
      7. perfect positive correlation
    4. The slope of the least squares regression line is the average pace of the runner.   Determine and write down the slope of the least squares regression line.

      slope = _____________
    5. The Pearson product-moment correlation coefficient represents how well the runner held a fairly constant pace during the run.  A perfect correlation would be constant pace, a high correlation would represent a fairly constant pace.  Calculate the Pearson product-moment correlation coefficient r.

      r = _____________
    6. Based on the correlation coefficient r, did the runner hold a fairly constant pace?
    7. Find the Coefficient of Determination r².

      coefficient of determination = _____________
    8. What does the Coefficient of Determination tell us for this model?
    9. _______ Is the growth rate reasonably well modeled by a linear equation?

      Why?

Normal Probability Distribution

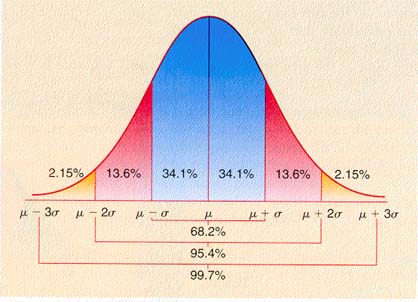
  1. Suppose that the data in the first section of this test was normally distributed and that the population mean m was 460 and the population standard deviation s was 70. Remember that 1213 students took the TOEFL test.  Use the normal probability distribution to predict the number of students who scored between 390 and 460.  (This number is going to be roughly equal to number of student entering our IEP program!)


    normal_curve.jpg (22909 bytes)
Statistic Equations Excel
Mean = xbar.gif (842 bytes) = x P(x) =AVERAGE(data)
Sample Standard Deviation = sx
= sampstdev.gif (1072 bytes)
=STDEV(data)
Population Standard Deviation = s
= probabilitypopstdev.gif (1053 bytes)
=STDEVP(data)
Slope =SLOPE(y data, x data)
Intercept =INTERCEPT(y data, x data)
Correlation =CORREL(y data, x data)