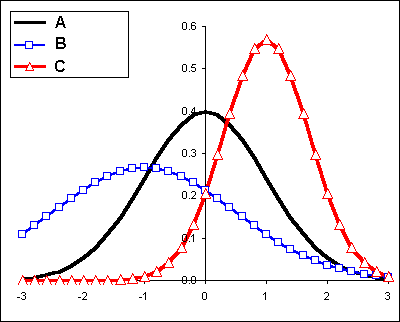
- Which curve has the smallest mean? _______
- Which curve has the smallest standard deviation? _______
- What is the mean for curve A? _______
- What is the apparent mean for curve B? ___________
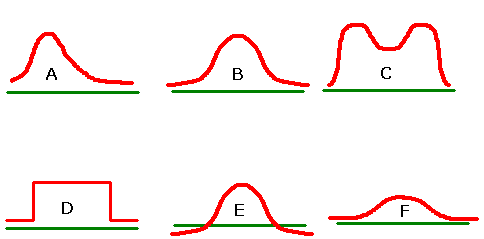
Which, if any, of the curves in the figure above look(s) like a normal curve? If the curve is a normal curve, tell why.