|
Tire pressure/psi |

|
|
33 |
|
35 |
|
31 |
|
34 |
|
27 |
|
25 |
|
31 |
|
28 |
|
30 |
|
33 |
|
30 |
|
31 |
|
29 |
|
32 |
|
28 |
| 1 |
ratio |
What level of measurement is tire pressure in pounds per square inch? |
|
|
|
|
| 2 |
15 |
Find the sample size n for the tire pressure data. |
|
|
|
|
| 3 |
25 |
Find the minimum tire pressure. |
|
|
|
|
| 4 |
35 |
Find the maximum tire pressure. |
|
|
|
|
| 5 |
10 |
Find the range of the tire pressure. |
|
|
|
|
| 6 |
31 |
Find the median tire pressure. |
|
|
|
|
| 7 |
31 |
Find the mode for the tire pressure. |
|
|
|
|
| 8 |
30.47 |
Find the sample mean tire pressure. |
|
|
|
|
| 9 |
2.75 |
Find the sample standard deviation for the tire pressure. |
|
|
|
|
| 10 |
0.0902 |
Find the sample coefficient of variation CV. |
|
|
|
|
| 11 |
2 |
Width |
|
|
|
|
| 12 |
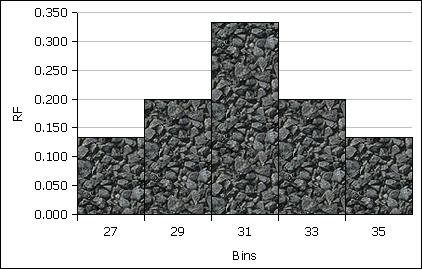
Bins (x) |
Frequency (f) |
Rel. Freq. p(x) |
|
|
|
|
27 |
2 |
0.133 |
|
|
|
|
29 |
3 |
0.200 |
|
|
|
|
31 |
5 |
0.333 |
|
|
|
|
33 |
3 |
0.200 |
|
|
|
|
35 |
2 |
0.133 |
|
|
|
|
Sum: |
15 |
1 |
|
|
|
| 13 |
Sketch a relative frequency histogram |
|
|
|
|
|
| 14 |
symmetric |
What is the shape of the distribution? |
|
|
|
|
|
Calculation of Mean from Frequency Table |
|
|
|
|
|
|
Mean from frequency distribution Grade bins |
Freq |
RF or P(x) |
x*p(x) |
|
|
|
168 |
112 |
0.05 |
7.85 |
|
|
|
316 |
658 |
0.27 |
86.75 |
|
|
|
464 |
1172 |
0.49 |
226.87 |
|
|
|
612 |
332 |
0.14 |
84.77 |
|
|
|
760 |
123 |
0.05 |
39 |
|
|
|
Sums: |
2397 |
1 |
445.23 |
|
|
| 15 |
445.23 |
What is the mean grade for the 2397 tires? |
|
|
|
|
|
Linear regression |
|
|
|
|
|
|
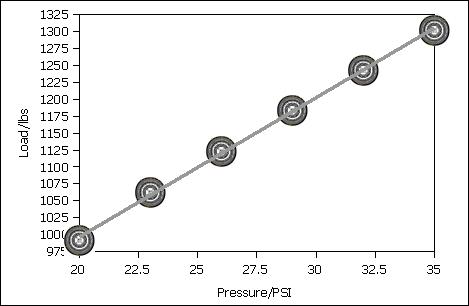
Linear regression Pressure/PSI |
Load/lbs |
|
|
|
|
|
20 |
992 |
|
|
|
|
|
23 |
1062 |
|
|
|
|
|
26 |
1123 |
|
|
|
|
|
29 |
1183 |
|
|
|
|
|
32 |
1243 |
|
|
|
|
|
35 |
1302 |
|
|
|
|
| 16 |
20.5 |
Calculate the slope of the linear trend line. |
|
|
|
|
| 17 |
586.95 |
Calculate the y-intercept for the data. |
|
|
|
|
| 18 |
positive |
Is the correlation positive, negative, or neutral? |
|
|
|
|
| 19 |
0.9996 |
Determine the correlation coefficient r. |
|
|
|
|
| 20 |
high (or perfect) |
Is the correlation none, low, moderate, high, or perfect? |
|
|
|
|
| 21 |
linear |
Does the relationship appear to be linear or non-linear? |
|
|
|
|
| 22 |
0.9992 |
Determine the coefficient of determination. |
|
|
|
|
| 23 |
99.92% |
What % in the variation in pressure variable accounts for the variation in load? |
|
|
|
|
| 24 |
1099.57 |
A tire with an inflation of 25 psi could be expected to bear what load in pounds? |
|
|
|
|
| 25 |
33.99 |
A load of 1284 pounds would require what inflation pressure? |
|
|
|
|
| 26 |
Tire would blow |
A tire with an inflation of 100 psi could be expected to bear what load in pounds? |
|
|
|
|
|
Normal curves |
|
|
|
|
|
| 27 |
C |
Which of the following curves is a normal curve? |
|
|
|
|
|
For the following normal distribution determine: |
|
|
|
|
|
| 28a |
5.5 |
What is the mean? |
|
|
|
|
| 28b |
2.2 |
What is the standard deviation? |
|
|
|
|

|
|
|
|
|
|
|
|
|
|
|
|
|
|
|
|
|
|
|
|


