MS 150 Statistics Fall 2004 Test One • Name:
Enrollment at the six campuses of the College of Micronesia-FSM is given below.
Enrollment by Campus
| Campus | Number of students (Frequency f) | Relative Frequency |
|---|
| Chuuk | 680 | |
| Kosrae | 240 | |
| National | 890 | |
| Pohnpei | 568 | |
| Yap w/FSM-FMI | 174 | |
| Sum: | | |
- Fill in the relative frequency column and the sum row in the above table.
- Sketch a pie chart for the frequency column of the above data on this page.
- The developer of the new COM-FSM Entrance Test (COMET) is interested in understanding how well the test will predict where new freshmen should be placed in an English class. The test will be given to approximately 2000 high school seniors across the nation in February 2005. The developer gives the test to 80 students in developmental English class during the spring of 2004 and analyzes those results.
- ______________________________ What is the intended population?
- ______________________________ What is the sample?
- A sample of ramen products was taken with the prices being recorded in cents. The
products had the following prices:
25, 25, 25, 25, 30, 30, 30, 32, 32, 40, 41, 50, 60, 70, 100
- __________ What is the minimum value in this data set?
- __________ What is the maximum value in this data set
- __________ What is the range for this data?
- __________ If this data is to be divided into five bins, what is the width of a single bin?
- Determine the frequency and calculate the relative frequency using five bins (classes, intervals). Record your results in the table provided.
| Bins ( Classes or Intervals) | Frequency |
|---|
| | |
| | |
| | |
| | |
| | |
| Sum: | |
- Sketch a frequency histogram of the data, labeling your horizontal axis and vertical axis as appropriate.
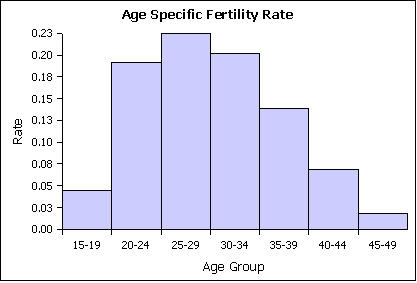
- The age specific fertility rate (ASFR) is number of births to women in a given age group, per 1,000 women in that age group. The chart below depicts the age specific fertility rate for women in the FSM in the year 2000. The value on the graph is the number of children born per one thousand women in that age range.

- ____________ What is the shape of the distribution?
- ____________ What age group has the highest fertility?
- ____________ The above data is for all women in the FSM. Would this study be considered a census or a sample?
- Why aren't the women younger than 15 or older than 49 included in the study?
