1. For the following curves A, B, and C determine the mean µ and the standard deviation
σ:

| Curve | Mean µ | standard deviation σ |
|---|---|---|
| A | ||
| B | ||
| C |
2. Twelve fruit bats from the lagoon islands of Chuuk state were measured and found to have a mean skull length µ of 44.708 mm with a standard deviation σ of 0.593 mm. Presume that the distribution of skull lengths is normally distributed about the mean.
| Statistic or Parameter | Symbol | Equations | Excel |
|---|---|---|---|
| Calculate a z value from an x | z | =

|
=STANDARDIZE(x, µ, σ) |
| Calculate an x value from a z | x | = z * σ + µ | = z*σ+µ |
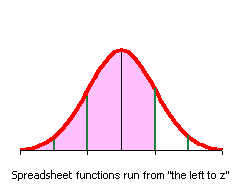
| Find a probability p from a z value (the area to the left of z) | =NORMSDIST(z) | ||
| Find a z value from a probability p (from the area p to the left of z) | =NORMSINV(p) | ||

