| Country/area |
Deaths |

|
| FSM |
40 |
| Guam |
71 |
| Kiribati |
31.5 |
| Marshall Islands |
16.5 |
| Nauru |
2.5 |
| Northern Mariana Islands |
31 |
| Palau |
9.5 |
| American Samoa |
21.5 |
| Cook Islands |
7.5 |
| Niue |
1 |
| Samoa |
67.5 |
| Tokelau |
1 |
| Tonga |
41 |
| Tuvalu |
4.5 |
| Wallis and Futuna |
5.5 |
| Bins |
Frequency |
Rel Freq f/n |
|
|
|
|
| 15 |
7 |
0.47 |
|
|
|
|
| 29 |
2 |
0.13 |
|
|
|
|
| 43 |
4 |
0.27 |
|
|
|
|
| 57 |
0 |
0 |
|
|
|
|
| 71 |
2 |
0.13 |
|
|
|
|
| Sums: |
15 |
1 |
|
|
|
|
| 15 |
Determine the sample size n. |
|
|
|
|
|
| 1 |
Determine the minimum. |
|
|
|
|
|
| 71 |
Determine the maximum. |
|
|
|
|
|
| 70 |
Calculate the range. |
|
|
|
|
|
| 14 |
Determine the bin width. Use 5 bins. |
|
|
|
|
|
|
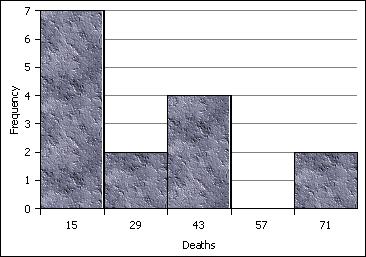
Fill in the following table with the bin upper limits in the first column, the frequencies in the second column |
|
|
|
|
|
|
Sketch a histogram of the frequency data on this paper, using the back if necessary. |
|
|
|
|
|
| Skewed |
What is the shape of the distribution? |
|
|
|
|
|

