MS 150 Statistics Fall 2005 Mx • Name:
Interhill data |
Shoes by Mizuno
| Segment | Distance (m) |
|---|
| Paies to Snowland hill | 945 |
| Snowland hill to Irohir | 1020 |
| Irohir to 3rd hill | 405 |
| 3rd hill to Nankapw | 1385 |
| Nankapw to 3rd hill | 1385 |
| 3rd hill to Irohir | 393 |
| Irohir to Snowland hill | 1035 |
| Snowland to Paies | 945 |
|
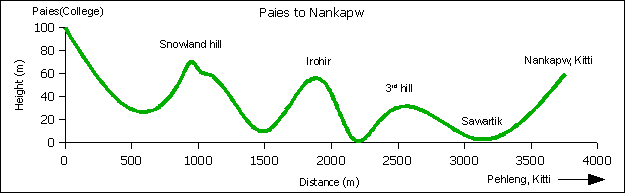
 Between the college here in Paies and the Pehleng headstart center in Nankapw, Pehleng, Kitti, the land is folded like a corrugated tin roofing sheet. A run out to Nankapw and back is a series of uphill and downhill segments, one of the most difficult kinds of road running terrain. Workouts which alternate between hard pushes (uphill) with easy running (downhill) are called interval workouts. Interval workouts are known to be beneficial to building speed and stamina. The distance between the hills is a measure of the intensity of the workout. This first section of the midterm analyzes the hill-to-hill (interhill) distance. A cross-section of the terrain is shown in the diagram below. Differences in the segment distances are because actual measurements were made with global positioning satellite unit carried by a runner.
Basic statistics, frequencies, and histogram
- __________ What level of measurement is the interhill distance data?
- __________ Find the sample size n for the interhill distance data.
- __________ Find the minimum interhill distance.
- __________ Find the maximum interhill distance.
- __________ Find the range of the interhill distance.
- __________ Find the median interhill distance.
- __________ Find the mode for the interhill distance.
- __________ Find the sample mean x interhill distance.
- __________ Find the sample standard deviation sx for the interhill distances.
- __________ Find the sample coefficient of variation CV.
- __________ If this data were to be divided into four bins, what would be the width of a single bin?
- Determine the frequency and calculate the relative frequency using four bins. Record your results in the table provided.
Frequency table
| Bins (x) | Frequency (f) | Rel. Freq. p(x) |
|---|
| _______ | _______ | _______ |
| _______ | _______ | _______ |
| _______ | _______ | _______ |
| _______ | _______ | _______ |
| Sum: |
_______ | _______ |
- Sketch a relative frequency histogram chart of the data here or on the back, labeling your horizontal axis and vertical axis as appropriate.
- ____________________ What is the shape of the distribution?
Calculation of Mean from Frequency Table
The new flying disk golf course here at the college features segments of par three, four, and five. Use the table below to calculate the average par per segment.
Berger Flying Disk Golf Course
| Par bin | Freq | RF or p(x) | x*p(x) |
|---|
| 2 | 0 | | __________ |
| 3 | 7 | | __________ |
| 4 | 5 | | __________ |
| 5 | 4 | | __________ |
| Sums: | __________ | __________ | __________ |
|---|
- __________ What is the mean par per segment?

Linear regression
The following data shows the speed of the runner (y) at a time (x) during the run.
Interhill data
| Segment | Time (min) | Speed (m/s) |
|---|
| Paies to Snowland hill | 5.4 | 2.94 |
| Snowland hill to Irohir | 11.4 | 2.79 |
| Irohir to 3rd hill | 13.9 | 2.76 |
| 3rd hill to Nankapw | 23.0 | 2.56 |
| Nankapw to 3rd hill | 32.1 | 2.52 |
| 3rd hill to Irohir | 34.8 | 2.46 |
| Irohir to Snowland hill | 42.3 | 2.31 |
| Snowland to Paies | 49.9 | 2.08 |
- __________ Calculate the slope of the linear trend line (also known as best fit line, least squares, linear regression) for the weekday versus remaining balance data.
- __________ Calculate the y-intercept for the data.
- __________ Is the correlation positive, negative, or neutral?
- __________ Determine the correlation coefficient r.
- __________ Is the correlation none, low, moderate, high, or perfect?
- __________ Does the relationship appear to be linear or non-linear?
- __________ Determine the coefficient of determination.
- __________ What percent in the variation in time accounts for the variation in the speed of the runner?
- __________ What is the projected starting speed of the runner at time zero?
- __________ If this trend were to continue, what would be the projected speed of the runner at 60 minutes?
- What is happening to the runner according to our analysis above?
Why?
Table of statistical functions used by Excel
| Statistic or Parameter |
Symbol |
Equations |
Excel |
| Square root |
|
|
=SQRT(number) |
| Sample mean |
x |
Σx/n |
=AVERAGE(data) |
| Sample standard deviation |
sx |
|
=STDEV(data) |
| Sample Coefficient of Variation |
CV |
sx/x |
=STDEV(data)/AVERAGE(data) |
| Binomial distribution expected outcome |
µ |
np |
=n*p |
| Slope |
b |
|
=SLOPE(y data, x data) |
| Intercept |
a |
|
=INTERCEPT(y data, x data) |
| Correlation |
r |
|
=CORREL(y data, x data) |
| Coefficient of Determination |
r² |
|
=(CORREL(y data, x data))^2 |
 Between the college here in Paies and the Pehleng headstart center in Nankapw, Pehleng, Kitti, the land is folded like a corrugated tin roofing sheet. A run out to Nankapw and back is a series of uphill and downhill segments, one of the most difficult kinds of road running terrain. Workouts which alternate between hard pushes (uphill) with easy running (downhill) are called interval workouts. Interval workouts are known to be beneficial to building speed and stamina. The distance between the hills is a measure of the intensity of the workout. This first section of the midterm analyzes the hill-to-hill (interhill) distance. A cross-section of the terrain is shown in the diagram below. Differences in the segment distances are because actual measurements were made with global positioning satellite unit carried by a runner.