MS 150 Statistics summer 2007 Mx • Name:
Joggling
| time/min |
|---|
| 2.77 |
| 2.86 |
| 2.86 |
| 2.81 |
| 2.81 |
| 2.82 |
| 2.82 |
| 2.80 |
| 2.88 |
| 2.91 |
| 2.88 |
| 2.92 |
| 2.67 |
| 2.76 |
| 2.69 |
| 2.64 |
| 2.66 |
Part I: Basic statistics, frequencies, histogram, z-scores, normal distribution.
Last night I went out and ran a midsummer's night seventeen joggling laps at the track. I timed each lap. Use my lap times for this first part of the test.
- __________ What level of measurement is the data?
- __________ Find the sample size n for the data.
- __________ Find the minimum.
- __________ Find the maximum.
- __________ Find the range.
- __________ Find the median.
- __________ Find the mode.
- __________ Find the sample mean x.
- __________ Find the sample standard deviation sx.
- __________ Find the sample coefficient of variation CV.
- __________ If this data were to be divided into four bins, what would be the width of a single bin?
- Determine the frequency and calculate the relative frequency using four bins. Record your results in the table provided.
Frequency table
| Bins (x) | Frequency (f) | Rel. Freq. p(x) |
|---|
| _______ | _______ | _______ |
| _______ | _______ | _______ |
| _______ | _______ | _______ |
| _______ | _______ | _______ |
| Sum: |
_______ | _______ |
- Sketch a frequency histogram chart of the data here or on the back, labeling your horizontal axis and vertical axis as appropriate.
- ____________________ What is the shape of the distribution?
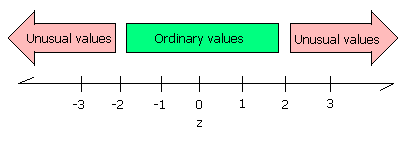
- ____________________ Use the mean ” and standard deviation σ calculated above to determine the z-score for the 2.92 minute lap.
- ____________________ Does the 2.92 minute lap have an ordinary or unusual z-score?
- ____________________ Bearing in mind that higher lap times are slower laps and slower speeds. Was my speed unusually low as measured by z-score?
- ____________________ Use the mean ” and standard deviation σ calculated above to determine the lap time which would have a z-score equal to negative two. Any lap time less than this value would be an unusually fast lap (low times are fast laps).
Part II: Linear regression
LRC: Building H
| Month | Month number (x) | Power/KwH (y) |
|---|
| Oct 06 | 10 | 24100 |
| Nov 06 | 11 | 26800 |
| Dec 06 | 12 | 26300 |
| Jan 07 | 13 | 20400 |
| Feb 07 | 14 | 26000 |
| Mar 07 | 15 | 17500 |
| Apr 07 | 16 | 27700 |
| May 07 | 17 | 23400 |
On Thursday maintenance released their semi-annual energy audit spreadsheet. The building that uses the most power is the Learning Resource Center. The table provides power consumption data in kilowatt-hours (KwH). For comparison purposes, my own home uses about 290 KwH per month.
- __________ Calculate the slope of the linear trend line for the data.
- __________ Calculate the y-intercept for the data.
- __________ Is the correlation positive, negative, or neutral?
- __________ Determine the correlation coefficient r.
- __________ Is the correlation none, low, moderate, high, or perfect?
- __________ Does the relationship appear to be linear or non-linear?
- __________ What is the projected power consumption a year from now in month number 41?
- __________ What month number had a power consumption of 25918 KwH?
Table of statistical functions used by OpenOffice
| Statistic or Parameter | Symbol | Equations | OpenOffice |
|---|
| Square root | | | =SQRT(number) |
| Sample mean | x |
Σx/n | =AVERAGE(data) |
| Sample standard deviation | sx | | =STDEV(data) |
| Sample Coefficient of Variation | CV | sx/
x |
=STDEV(data)/AVERAGE(data) |
| Calculate a z value from an x | z | =
 |
=STANDARDIZE(x;μ;σ) |
| Slope | b | | =SLOPE(y data;x data) |
| Intercept | a | | =INTERCEPT(y data;x data) |
| Correlation | r | | =CORREL(y data;x data) |

