| Bounce/cm |
|---|
| 72 |
| 73 |
| 77 |
| 77 |
| 77 |
| 78 |
| 80 |
| 81 |
| 82 |
| 83 |
| 83 |
| 84 |
| 84 |
| 86 |
| 87 |
| 88 |
| 91 |
| 109 |
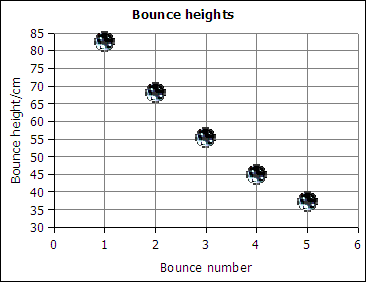
A golf ball was dropped and bounce heights in centimeters were measured as seen in the table. Use the data in the table to answer the following questions.
| Bounce number (x) | Bounce height/cm (y) |
|---|---|
| 1 | 82 |
| 2 | 68 |
| 3 | 55 |
| 4 | 45 |
| 5 | 37 |
| 6 | 32 |
| Linear Regression Functions | |||
|---|---|---|---|
| Statistic or Parameter | Math symbol | Stat symbol | OpenOffice |
| Slope | m | b | =slope(y-data;x-data) |
| Intercept | b | a | =intercept(y-data;x-data) |
| Correlation | r | =correl(y-data;x-data) | |
| Coefficient of Determination | r2 | =(correl(y-data;x-data))^2 | |