Statistics learning outcomes status report

02 September 2007

Early drafts of the present accreditation standards on assessment referred to a desire by the commission that there be an ongoing dialog about learning and assessment. Dialog as in a meaningful exchange of information. Assessment has tended to be a monologue, of which I continue to be guilty. Yet I do not know how to start a dialog if no one says anything. So I continue my monologues on the assessments I am doing in my own classrooms.

MS 150 Statistics remains a fairly traditional chalk and talk lecture style course. The course coverage well echoes industry standard texts. The topics are typical of many community college introductory statistics courses, and the course articulates well to other institutions. Assessment remains driven by quizzes, tests, a midterm, and a final. The model of assessment of course level student learning outcomes is one in which performance on student learning outcomes is aggregated to generate higher level assessments. This is one of the models that I outlined in the SLOAP presentation in the spring of 2006.

Individual item analysis of quizzes and tests is mapped to outcomes on the course outline. The aggregated average performance on all outcomes is then used as a way of reporting "internal" accomplishment of the program learning outcome. This first table details the item analysis on instruments since term start:
Src Q Description l Outref SLO Corr Corr%
Pre P1 level of measure 1 1 Calculate basic statistics 2 5%
Pre P2 sample size 1 1 Calculate basic statistics 5 12%
Pre P3 mean 1 1 Calculate basic statistics 9 21%
Pre P4 median 1 1 Calculate basic statistics 13 31%
Pre P5 mode 1 1 Calculate basic statistics 4 10%
Pre P6 min 1 1 Calculate basic statistics 34 81%
Pre P7 max 1 1 Calculate basic statistics 34 81%
Pre P8 range 1 1 Calculate basic statistics 10 24%
Pre P9 standard dev 1 1 Calculate basic statistics 3 7%
Pre P10 coef var 1 1 Calculate basic statistics
0%
Pre P11 slope 5 5 Perform a linear regression and make inferences based on the results 4 10%
Pre P12 intercept 5 5 Perform a linear regression and make inferences based on the results 4 10%
Pre P13 slope-intercept eqn 5 5 Perform a linear regression and make inferences based on the results 1 2%
Pre P14 predict y given x 5 5 Perform a linear regression and make inferences based on the results 6 14%
Pre P15 predict x given y 5 5 Perform a linear regression and make inferences based on the results 4 10%
q01 1234 level of measure 1 1 Calculate basic statistics 10 20%
q01 5 calculate percentage 1 1 Calculate basic statistics 23 46%
q01 6 completed homework 1 1 Calculate basic statistics 35 70%
q01 78 remembered weight, bfi 1 1 Calculate basic statistics 48 96%
q01 9 perform percent multiplication 1 1 Calculate basic statistics 47 94%
q01 10 recall fact 1 1 Calculate basic statistics 47 94%
q01 11 recall fact 1 1 Calculate basic statistics 44 88%
q01 12 body fat classification 1 1 Calculate basic statistics 36 72%
q02 1 level of measure 1 1 Calculate basic statistics 14 29%
q02 2 min 1 1 Calculate basic statistics 46 96%
q02 3 max 1 1 Calculate basic statistics 42 88%
q02 4 range 1 1 Calculate basic statistics 34 71%
q02 5 bin width 2 2 Represent data sets using charts and histograms 34 71%
q02 6 frequency table 2 2 Represent data sets using charts and histograms 9 19%
q02 7 histogram chart 2 2 Represent data sets using charts and histograms 10 21%
q02 8 shape of distribution 2 2 Represent data sets using charts and histograms 4 8%

The above data is aggregated in the following table which is using the reduced set of outcomes found in the proposed MS 150 outline:
Outref Students will be able to: Sum Count Avg
1 Calculate basic statistics 11.35 22 52%
2 Represent data sets using charts and histograms 1.19 4 30%
3 Solve problems using normal curve and t-statistic distributions including confidence intervals for means and hypothesis testing 0 0 0%
4 Determine and interpret p-values 0 0 0%
5 Perform a linear regression and make inferences based on the results 0.45 5 9%
PSLO define mathematical concepts, calculate quantities, estimate solutions, solve problems, represent and interpret mathematical information graphically, and communicate mathematical thoughts and ideas.

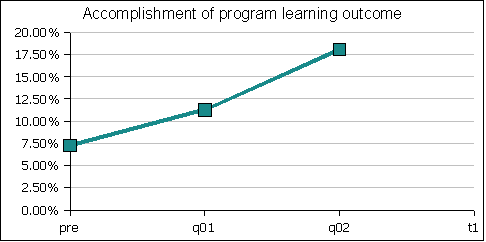
18.06%

Note that these proposed outcomes are also on the current outline as course level outcomes. The proposed outline simplifies the outline by removing the plethora of individual specific learnings, performance of which is documented in the first table above. This revision to reduce to a set of five broader outcomes is in line with the direction the curriculum committee has been taking over the past twelve to eighteen months.

Note that in the table above the sum and count columns do not have any direct meaning, they are intermediate values. The Avg column reports the average rate of success on items classified as basic statistics.

The aggregate accomplishment of the PSLO over time is depicted in the following chart:
PSLO 0831
Note that at term start (pre is the pretest) the students were already able to perform some basic statistical calculations.

In the world of I, P, D this course has the difficulty of being a solo shot at statistics for all students in associate degree programs. The course introduces concepts, students practice them, and then demonstrate proficiency on internal quizzes and tests. While some students may go on to the third year business program and take Business Statistics, this cannot be said to be the P or D for MS 150 as that is a wholly separate program with its own entrance requirements.

I will be using statistics in SC 130 Physical Science, but MS 150 Statistics is not a pre-requisite nor will it likely ever be a pre-requisite course. On the contrary, SC 130 is a good place to introduce concepts such as standard deviation. The two courses well reinforce each other, with either one being good "practice" for the other.

My hope ultimately is that others will find a useful assessment idea here or there among the tremendous amount of chaff I generate.

As always I long for IRPO to bring back information from the field - from alumni, employers, and the community - on whether MS 150 alumni are a) using statistics, b) able to effectively use statistics, and c) what they need to do that the course did not prepare them to do. This would provide critical triangulation information.