MS 150 Statistics fall 2007 heat conductors mx • Name:
Heat conduction
| Material | ΔT/°C |
|---|
| Aluminum | 6 |
| Brass | 6 |
| Copper | 12 |
| Glass | 0 |
| Iron | 8 |
| Lead | 3 |
| Nickel | 7 |
| Plastic | 0 |
| Rubber | 0 |
| Steel | 11 |
| Tin | 7 |
| Wood | 0 |
| Zinc | 4 |
Part I: Basic statistics, frequencies, histogram, z-scores, normal distribution.

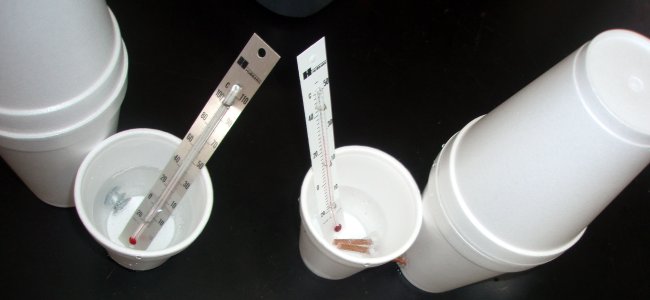
The SC 130 Physical Science students conducted an experiment in which they measured the heat conductivity of various materials. For each material they measured the temperature rise (ΔT) of water as a result of heat being conducted through the material. The second column of the table records the temperature rise (ΔT) in degrees Celsius (°C). Use the temperature rise data to answer the following questions.
- __________ What level of measurement is the data?
- __________ Find the sample size n for the data.
- __________ Find the minimum.
- __________ Find the maximum.
- __________ Find the range.
- __________ Find the median.
- __________ Find the mode.
- __________ Find the sample mean x.
- __________ Find the sample standard deviation sx.
- __________ Find the sample coefficient of variation CV.
- __________ If this data were to be divided into four bins, what would be the width of a single bin?
- Determine the frequency and calculate the relative frequency using four bins. Record your results in the table provided.
Frequency table
| Temperature bins (x) | Frequency (f) | Rel. Freq. p(x) |
|---|
| | | | | |
| | | | | |
| | | | | |
| | | | | |
| Sum: |
| | |
- Sketch a frequency histogram chart of the data anywhere it fits, labeling your horizontal axis and vertical axis as appropriate.
- ____________________ What is the shape of the distribution?
- ____________________ Use the mean µ and standard deviation σ calculated above to determine the z-score for a material that produces a temperature rise of 9 °C.
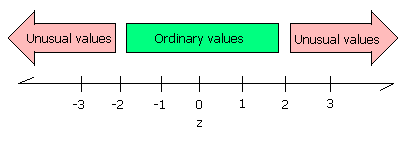
- ____________________ Is a 9 degree temperature rise an ordinary or unusual z-score?
Tossing seven pennies
| Heads (bins) | Freq F | Rel Freq p(x) | x*p(x) |
|---|
| 7 | 9 | 0.01 | 0.07 |
| 6 | 41 | 0.04 | 0.26 |
| 5 | 167 | 0.18 | 0.89 |
| 4 | 266 | 0.28 | 1.14 |
| 3 | 255 | 0.27 | 0.82 |
| 2 | 139 | 0.15 | 0.30 |
| 1 | 50 | 0.05 | 0.05 |
| 0 | 7 | 0.01 | 0.00 |
| | 934 | 1.00 | 3.53 |
- ____________________
Use the data in the table to determine the probability of four heads on a toss of seven pennies.
Use the data on the board to determine the probability of four heads on a toss of seven pennies.
- ____________________
Use the data in the table to determine the mean number of heads for tosses of seven pennies.
Use the data on the board to determine the mean number of heads for tosses of seven pennies.
- ____________________
What is the name of the shape of the smooth curve that is formed by plotting the relative frequency histogram for the seven pennies data using a smooth line?
Time versus temperature
| Time/min | Temp/°C |
|---|
| 0 | 28 |
| 5 | 33 |
| 10 | 37 |
| 15 | 39 |
| 20 | 40 |
Part II: Linear regression
A student measured the time versus the temperature rise for water containing a copper conductor. The water temperature data is provided in the table.
- __________ Calculate the slope of the linear trend line for the data.
- __________ Calculate the y-intercept for the data.
- __________ Is the correlation positive, negative, or neutral?
- __________ Determine the correlation coefficient r.
- __________ Is the correlation none, low, moderate, high, or perfect?
- __________ Does the relationship appear to be linear or non-linear?
- __________ Determine the coefficient of determination r² .
- __________ What is the predicted temperature at 8 minutes?
- __________ What is the predicted time at which the water temperature is 30°C?
Table of basic statistical functions used by OpenOffice
| Statistic or Parameter | Symbol | Equations | OpenOffice |
|---|
| Square root | √ | | =SQRT(number) |
| Sample size | n | | =COUNT(data) |
| Minimum | | | =MIN(data) |
| Maximum | | | =MAX(data) |
| Median | | | =MEDIAN(data) |
| Mode | | | =MODE(data) |
| Sample mean | x |
Σx/n | =AVERAGE(data) |
| Sample standard deviation | sx | | =STDEV(data) |
| Sample Coefficient of Variation | CV | sx/
x |
=STDEV(data)/AVERAGE(data) |
| Calculate a z value from an x | z | =
 |
=STANDARDIZE(x;μ;σ) |
Linear regression functions used by OpenOffice.org
| Slope | b | | =SLOPE(y data;x data) |
| Intercept | a | | =INTERCEPT(y data;x data) |
| Correlation | r | | =CORREL(y data;x data) |
| Coefficient of Determination | r² | |
=(CORREL(y data;x data))^2 |


