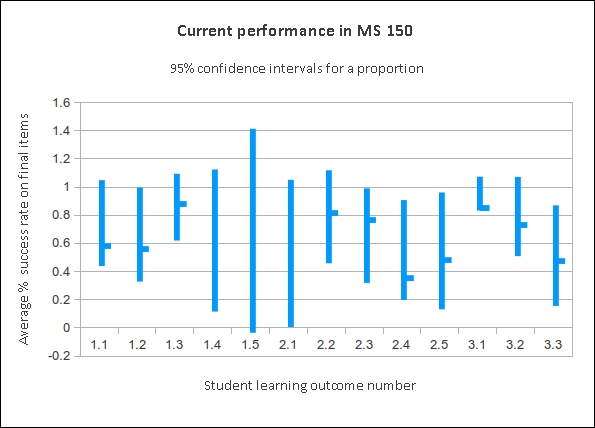
Chart one: 95% Confidence intervals for performance by SLO
The following document is based on the proposed outline. By using the outline as the basis for reporting assessment of learning, the document seeks to close the design-deploy-assess loop in a single document.
Course Description: A one semester course designed as an introduction to the basic ideas of data presentation, descriptive statistics, linear regression, and inferential statistics including confidence intervals and hypothesis testing. Basic concepts are studied using applications from education, business, social science, and the natural sciences. The course uses spreadsheet software for both data analysis and presentation.
| Deployed design | ↺ | Assessed result1 | ||||
|---|---|---|---|---|---|---|
| CLO | PLO 3.1 | PLO 3.2 | ↓ ↑ | CLO | PLO 3.1 | PLO 3.2 |
| 1 | I,D | I,D | 1 | 0.86 | 0.58 | |
| 2 | I,D | I | 2 | 0.52 | ||
| 3 | I,D | I,D | 3 | 0.68 | 0.86 | |
| Deployed design | ||
|---|---|---|
| CLO | PLO 3.1 | PLO 3.2 |
| 1 | 1.1 1.3 1.4 1.5 | 1.2 |
| 2 | 2.1 2.2 2.3 2.4 2.5 | 2.1 |
| 3 | 3.1 3.2 3.3 | 3.1 3.2 3.3 |
| Assessed result | |||
|---|---|---|---|
| CLO | SLO | PLO 3.1 | PLO 3.2 |
| CLO1 | 1.1 | 0.60 | |
| 1.2 | 0.56 | 0.58 | |
| 1.3 | 0.89 | ||
| 1.4 | 0.46 | ||
| 1.5 | |||
| CLO2 | 2.1 | ||
| 2.2 | 0.84 | ||
| 2.3 | 0.78 | ||
| 2.4 | 0.37 | ||
| 2.5 | 0.49 | ||
| CLO3 | 3.1 | 0.86 | |
| 3.2 | 0.75 | ||
| 3.3 | 0.49 | ||
| Student learning outcomes | Assessment strategies | iA2 |
|---|---|---|
| 1.1 Identify levels of measurement and appropriate statistical measures for a given level of measurement | Homework, quizzes and/or tests, data gathering project(s). | 0.60 |
| 1.2 Determine frequencies and relative frequencies, create histograms and identify their shape visually. | 0.58 | |
| 1.3 Calculate basic statistical measures of the middle, spread, and relative standing. | 0.90 | |
| 1.4 Calculate simple probabilities for equally likely outcomes. | Quizzes and/or tests | 0.46 |
| 1.5 Determine the mean of a distribution. | NA |
| Student learning outcomes | Assessment strategies | iA |
|---|---|---|
| 2.1 Calculate probabilities using the normal distribution | Homework, quizzes and/or tests. | NA |
| 2.2 Calculate the standard error of the mean | 0.84 | |
| 2.3 Find confidence intervals for the mean | 0.78 | |
| 2.4 Perform hypothesis tests against a known population mean using both confidence intervals and formal hypothesis testing | 0.37 | |
| 2.5 Perform t-tests for paired and independent samples using both confidence intervals and p-values | Homework, quizzes and/or tests, data gathering project(s). | 0.50 |
| Student learning outcomes | Assessment strategies | iA |
|---|---|---|
| 3.1 Calculate the linear slope and intercept for a set of data | Homework, quizzes and/or tests, data gathering project(s). | 0.87 |
| 3.2 Calculate the correlation coefficient r | 0.75 | |
| 3.3 Generate predicted values based on the regression | Homework, quizzes and/or tests. | 0.49 |

Chart one: 95% Confidence intervals for performance by SLO
The x-axis are the SLO's on the course outline
The y-axis is the percentage success rate for students based on an item analysis of the final examination. For example, 70% would mean that 70% of the 73 students who sat the examination answered correctly questions that fall under the given SLO.
The vertical line is the 95% confidence interval for performance on that SLO for the ten terms from fall 2005 to fall 2011 (excluding spring 2011 as that was a take-home test). Although the 95% confidence interval exceeds 100%, the number of students who successfully answer questions under an SLO cannot exceed 100%.
The horizontal tic mark on each 95% confidence interval is the performance on that SLO for this term based on the final examination.
Note that SLOs 1.4, 1.5, and 2.1 were not covered on the 44 question final examination. Those were tested earlier in the term.
This analysis is possible because the student learning outcomes have remained comparable since 2005.
Performance is within the expected range of performance and that performance this term is not unusually low. The image also indicates where performance this term exceeds 70% and where it does not.
Although there appeared to be declines for each student learning outcome against prior terms, the drop was not statistically significant at a 95%.
Note that student learning outcomes 1.4, 1.5, and 2.1 were not covered by the final examination. In-class quizzes and tests measured those outcomes.
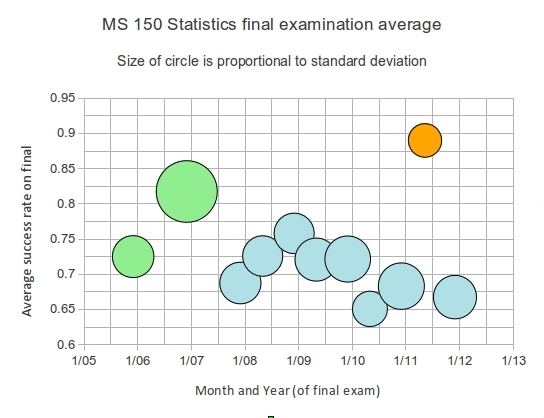
Another way to view performance across the terms is depicted in the following chart.

Chart two: Average performance on the final across multiple terms
Chart two depicts the average success rate on the final examinations based on the item analysis going back to 2005. The x-axis is the date of the final examination. The y-axis is the average success rate on the final examination. This is the same y-axis as chart one. The radius of the circle is the standard deviation of the success rate. Green circles were closed book examinations. Blue circles are proctored open book examinations. The orange circle was a take home examination.
There is the suggestion of a slide in performance since 2009. The only change in the course that dates from 2009 was the addition of a term long statistics project to try to increase the amount of writing in the course. The term project was unable to show a writing improvement and was modified into four much shorter mini-projects this term with no particular focus on writing. While one could conjecture as to how the project negatively impacted learning, there is no data that might connect the introduction of the project with a final examination performance impact.
MS 150 Statistics had three sections that ran Monday, Wednesday, and Friday for an hour each at 8:00, 9:00, and 10:00. The following table details average overall course performance by section and gender. The differences between sections are larger than the inter-gender differences within one section. The 8:00 class continues to underperform the other two sections.
| Section | Female | Male | Section average |
|---|---|---|---|
| 8:00 | 0.67 | 0.67 | 0.67 |
| 9:00 | 0.71 | 0.77 | 0.73 |
| 10:00 | 0.78 | 0.82 | 0.80 |
| Averages: | 0.72 | 0.76 | Overall: 0.74 |
The same analysis done only on the final examination found the same pattern of performance. The 9:00 section attained a 68% average on the final, the 10:00 section a 73% average. The 8:00 section underperformed at 61%.
1Average percent of students demonstrating the learning outcome. Average may be based on multiple encounters with the outcome on the final examination.
2 iA is Assessed result and is based on item analysis of final examination.