sd3 t02 mx 5.3 • Name:


Binky through the ages
| Term | Location | Time (min) |
|---|
| Summer 13 | Valley Binky | 53 |
| Spring 13 | ANR West | 28 |
| Fall 12 | Haruki South | 38 |
| Summer 12 | Swamp Binky | 30 |
| Spring 12 | Leach field | 15 |
| Fall 11 | Gym South | 8 |
| Summer 11 | Maintenance Binky | 26 |
| Spring 11 | Gym South | 45 |
The data are the time values in the third column of table one. The times are the length of time to find either Binky or Dana.
- n= __________ Calculate the sample size n for the time.
- Q0 = __________ Calculate the minimum (zeroth quartile).
- Q1 = __________ Calculate the first quartile.
- Q2 = __________ Calculate the median (second quartile).
 Q3 = __________ Calculate the third quartile.
- Q4 = __________ Calculate the maximum (fourth quartile).
- IQR = __________ Calculate the Inter-Quartile Range.
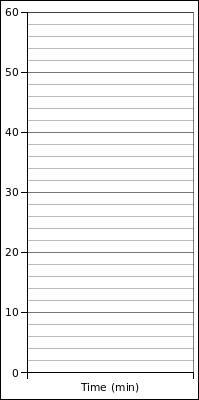
- Make a sketch of the box plot for the time data.
- mode = __________ Calculate the mode.
- x = __________ Calculate the sample mean x.
- sx = __________ Calculate the sample standard deviation sx.
- CV = __________ Calculate the sample coeficient of variation CV.
- z = __________ Calculate the z-score for 53 minutes.
- ______________ Is the z-score for 53 minutes an ordinary or extraordinary z-score?
- range = __________ Calculate the range.
- width = __________ If the time data is divided into five classes, what is the width of a single class?
-
Determine the frequency and calculate the relative frequency for the data.
Record your results in the table provided.
| Class upper limits | Frequency F | Rel. Freq. |
|---|
| | |
| | |
| | |
| | |
| | |
| Sums: | | |
- Sketch a frequency histogram for the data,
labeling your horizontal axis and vertical axis.
- ____________________ What is the shape of the histogram?
- __________ Based on the relative frequency data,
what is the probability of a time less than or equal to 17 minutes?
| Table two |
|---|
| milliminutes of arc | meters |
|---|
| 0 | 0 |
| 15 | 30 |
| 32 | 60 |
| 48 | 90 |
| 65 | 120 |
| 82 | 150 |
- _________ Calculate the sample size n (the number of data pairs) for the data in table two.
- ______________ Calculate the slope of the linear regression for the table two data.
- ______________ Calculate the y-intercept of the linear regression for the table two data.
- ______________ Is the relation positive, negative, or neutral?
- ______________ Calculate the correlation coefficient r for the data.
- ______________ Is the correlation none, weak/low, moderate, strong/high, or perfect?
- ______________ Calculate the coefficient of determination.
- ______________ What percent in the variation in the height explains the variation in the lap time?
- ______________ Use the slope and intercept to predict the meters for 100 milliminutes (the system does extrapolate).
- ______________ Use the slope and intercept to predict the milliminutes for 1000 meters.


 Q3 = __________ Calculate the third quartile.