MS 150 Statistics Summer 2001 Test Two

  1. The body fat percentage for the female students has a population mean of m of 31, a population standard deviation s of 8, and the data is normally distributed.
    1. The highest acceptable body fat for young females is 31.  What percent of the female students have body fat lower than 31?  That is, find P(x<31).


    2. The lower limit of obesity for young females is 39.  What percent of the female students have a body fat higher than 39?  That is, find P(x>39).


    3. If there are 400 female students, how many are obese?


    4. Suppose the College receives a grant to target the 80 most obese female students (equals the top 20%) with a diet and exercise program. What body fat should be set as the lower limit for entry into the program.  That is, find P(x > ?) = 0.20.


  2. Saramen Chuuk Academy (SCA) has a sample mean xbar.gif (842 bytes) TOEFL score of 470 with a population standard deviation s of 45 for n = 45 students.
    1. Construct a 95% confidence interval for the population mean m for SCA.


    2. Does the 95% confidence interval for SCA include the Berea Christian High School sample mean xbar.gif (842 bytes) TOEFL score of 481?


  3. Construct a 90% confidence interval for the population mean m body fat for male students using the following data:
    10.5, 14.7, 16.4, 18.2, 19.8, 23.4, 25.7, 30.2, 32.5, 35.2, 45.9
 

Statistic Equations Excel
Square root =SQRT(number)
Sample size n =COUNT(data)
Sample mean xbar.gif (842 bytes) =AVERAGE(data)
Population mean m
x P(x)
=AVERAGE(data)
Sample standard deviation sx
sampstdev.gif (1072 bytes)
=STDEV(data)
Population standard deviation s
probabilitypopstdev.gif (1053 bytes)
=STDEVP(data)
Slope =SLOPE(y data, x data)
Intercept =INTERCEPT(y data, x data)
Correlation =CORREL(y data, x data)
Find a probability p from a z value =NORMSDIST(z)
Find a z value from a probability p =NORMSINV(p)
Standard error of the population mean standard_error_mean_sigma.gif (945 bytes)
Standard error of the sample mean standard_error_mean_sx.gif (956 bytes)
Determining the z-statistic zc from a =NORMSINV(1-a/2)
Error tolerance E of a mean for n ³ 30 using s error_tolerance_e.gif (987 bytes) =CONFIDENCE(a,s,n)
Error tolerance E of a mean for n ³ 30 using sx error_tolerance_zc.gif (989 bytes) =CONFIDENCE(a,sx,n)
Error tolerance E of a mean for n < 30.  Can also be used for n ³ 30. error_tolerance_tc.gif (989 bytes) [no Excel function, determine tc and then multiply by standard error of the mean as shown in the equation]
Determining tc from a and the degrees of freedom df. =TINV(a,df)
Calculate a confidence interval for a population mean m from a sample mean xbar.gif (842 bytes) and an error tolerance E xbar.gif (842 bytes)-E<m<xbar.gif (842 bytes)+E

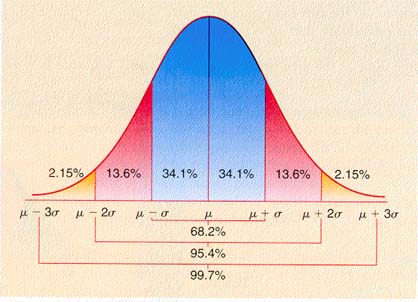
normal_curve.jpg (22909 bytes)

Statistic home Lee Ling home COM-FSM home page