Historically there has been moderate correlations between scores in English and mathematics on the college entrance test. This correlation has never been strong enough to use to predict mathematics placements from an English score, but they support a non-causal link between English skills and mathematics skills on the entrance test.
The following is a table of correlations for 230 regular freshmen who entered in the fall of 2005. This number is less than the actual number, the data I have is not complete for every student and the correlation analysis can only be run for students with complete data.
| x | ||||||||
| y | Structure | Reading | Writing | Placement | Group | Math | M | Sum |
| Structure | 1 | 0.25 | 0.48 | 0.46 | 0.36 | 0.39 | 0.46 | |
| Reading | 0.25 | 1 | 0.17 | 0.18 | 0.34 | 0.34 | 0.38 | |
| Writing | 0.48 | 0.17 | 1 | 0.48 | 0.26 | 0.25 | 0.32 | |
| Placement | 0.46 | 0.18 | 0.48 | 1 | 0.17 | 0.18 | 0.22 | |
| Math | 0.36 | 0.34 | 0.26 | 0.17 | 1 | 0.98 | 0.87 | |
| M | 0.39 | 0.34 | 0.25 | 0.18 | 0.98 | 1 | 0.87 | |
| Sum | 0.46 | 0.38 | 0.32 | 0.22 | 0.87 | 0.87 | 1 |
In the original data the Math column contains either 90, 95, 98, or
100. This is a non-linear scale. The M column contains a 1, 2, 3, or 4
for 90, 95, 98, or 100 respectively. This provides a linear scale to
run the English data against. The Sum column in the original data
contains the sum of the four math columns, in other words, the total
number correct. This can vary from 0 to 40. The sum is useless for
placement purposes, but correlates very strongly to placement. Thus
the sum is as good a single value as is available for correlation
studies against the English data.
Each row shows the correlation of the x-values in purple along the top
against the y-values on the left in pink. Thus the strongest
correlations can be seen for math placement, math level, and math sum
for the structure section of the test in the first row, and for reading
against the sum in the second row.
Only the numbers in red bold
exceed the critical value for significance at an alpha of 0.05 (5%) on
a two-tailed test for significance. Thus only the structure and
reading tests are significantly correlated with the math sum. The
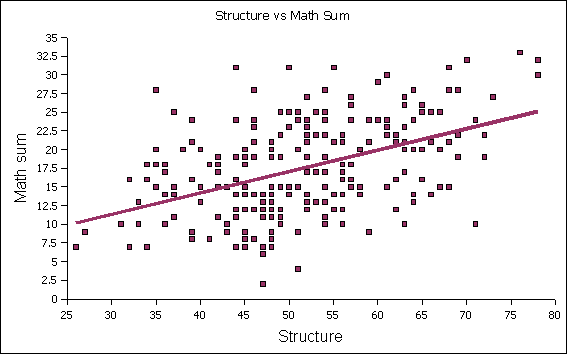
essay is not significantly correlated. The following x-y scatter graph
shows the distribution of the structure versus the math sum:

Again, these correlations are not strong enough to place students in
mathematics. This study must be viewed with considerable caution - it
is only a study of 230 students, a subset of those admitted to
associate degree programs. This is a large subset, but still
potentially problematic. This said, I would note with caution that the
data supports the contention I made at the mathematics meeting that
students who achieve admission to associate's degree program are
already above the weakest level of performance in mathematics.
Put another way, the national site might not see many students who
could not achieve success at MS 090 in its new PreAlgebra format if
they worked hard. The state sites, however, are likely to see weaker
students and may find a need for a re-purposed and re-developed MS
065.
Post-Script of interest only to those working on the admission's
cut-off
One of the site directors asked that students below "MS 090 PreAlgebra"
level in mathematics not be admitted. This generates the obvious
question, "What are the lowest scores on the math entrance test?"
Given that the test is multiple choice with five options on 40
questions, students should theoretically randomly get eight correct.
Yet there are admitted students performing well below this number. The
following is the data for three students below a sum of seven:
| 1 | Pohnpei | PICS | 47 | 14 | 24 | 29 | 1b | 90 | 1 | 2 | Chuukese | Y | |
| 2 | Pohnpei | OCHS | 51 | 20 | 25 | 33 | 2c | 90 | 1 | 4 | PNI | Y | |
| 3 | Pohnpei | PSDA | 47 | 17 | 33 | 24 | 2d | 90 | 1 | 6 | Kaping | Y |
Why they scored so poorly is left a mystery.
I would note that all three were on the deficiency list at midterm -
that is the "Y" on the far right side (thanks JG!).
This is why when I designed the limbo (non-admitted) group I avoided
making the cut-off dependent on a single score - a student might wipe
out mysteriously on a single test. By using a sum of z-scores only
students who have done poorly on all of the tests collectively wind up
in the non-admitted category. This removes the risk that one single
test could knock off your chance at attending college, but it also
means that we would not be building a system that ensured every student
was above some particular level in mathematics.