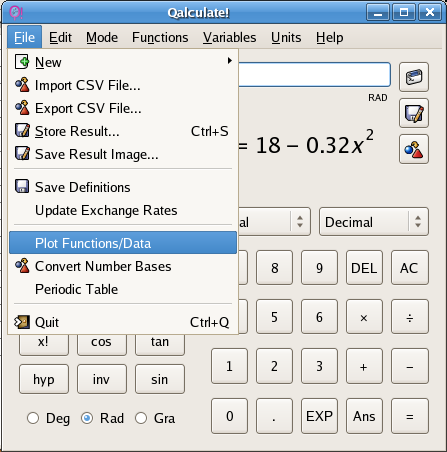
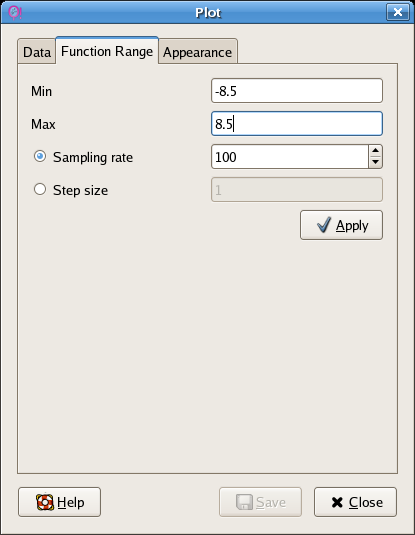
- 12. Click on the Function Range tab and
set your min to one less than your negative root, your max to one
more than your positive root.
-
|
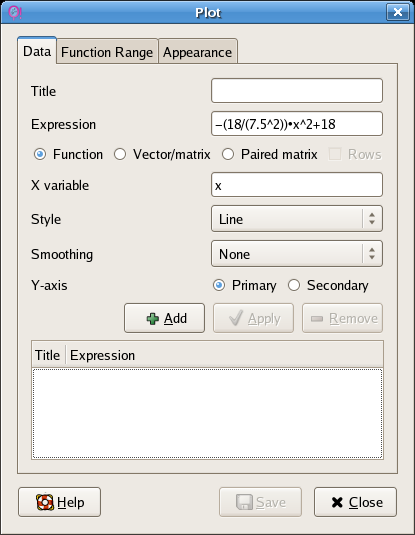
- 13. Return to the data tab (seen above,
and click on the +Add button. The graph of you marble will
appear.
-
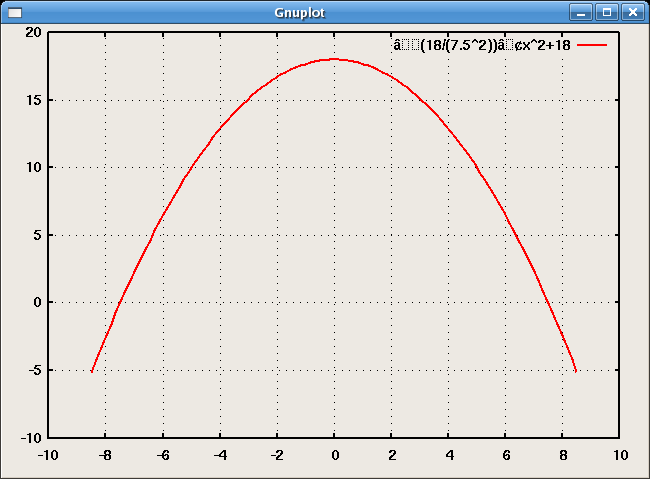
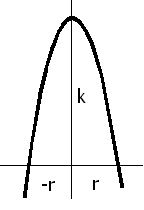
- Do the x-intercepts and the vertex agree
with the measurements made for your marble?
|