
Speaking on a carved soap box
A core concept in the physical sciences is the idea that physical systems obey mathematical equations. The mathematical equations are also called mathematical models or mathematical relationships.. If two variables are related by a mathematical equation, then predictions can be made about that physical system. Physics, engineering, and chemistry all depend on predictable results. When something is done in the same way twice, the same result should occur.
One way to begin to find the mathematical equation that relates two variables is to make an xy scatter graph. The graph will help indicated whether a relation exists between the variables. The graph will also help us determine the nature of the relationship. By nature we mean whether the relationship is linear or non-linear.
If the relationship is linear or non-linear, then the system behaves in a predictable manner. Given the value of one variable, we can predict the value of the other variable. In this class we will only try to make predictions for linear relationships. Non-linear relationships are also predictable, but the mathematics is beyond the scope of this course.
If the relationship is linear, then the equation has the form y = startValue + Rate * x. You may be more familiar with the form y = mx + b. In physics the slope m is often a rate of change and the y-intercept b is often a startValue. The y-intercept is not always the startValue, but for many systems the y-intercept, where x = 0, is a starting place for a system.
If we find that a relationship does form a roughly straight line, then we will try to find the slope and intercept.
The following graphs show the different types of relationship that might exist between two variables.
To decide on whether a relationship exists between two variable start with an xy scattergraph. Looking at the graph, consider the following questions.
If the data forms roughly a line and (0,0) both appears to be a data point and makes sense as a data point, then use the spreadsheet function LINEST to get the slope with the y-intercept set to 0. If the data forms roughly a line and (0,0) is not a valid data point, then use the spreadsheet function SLOPE and INTERCEPT to obtain the slope and intercept.
The following decision flow chart is a map of the flow of decisions described above.
The functions provided in the above chart are specified in more detail below. The format shown is the OpenOffice.org Calc format. If using Excel, substitute commas for the the semi-colons.
The first function finds the slope of a line with the y-intercept equal to 0
=LINEST(y-data;x-data;0)
The following two functions calculate the slope and intercept for any linear relationship.
=SLOPE(y-data;x-data)
=INTERCEPT(y-data;x-data)
If the data points form a line or roughly close to a line, then we can draw a line through the points. This line that best goes through the data points is called a best fit line or a linear regression. The functions above calculate the slope and intercept for this line through the data points. Linear regressions are an important mathematical tool in the physical sciences.
Physical science has special terms used to describe measurements.
Primary measurements: A quantity that is directly measured using an measuring device or instrument. Measuring devices might include rulers, stopwatches, mass balances, protractors, and thermometers.
Calculated measurement: A quantity calculated from a mathematical combination of primary measurements.
All measurements are expressed as the combination of a number and the units of measure. Whenever I speak about a measurement in science I must say both the measurement and the units. Thus I say "Five centimeters" or "Three volts." Number and units. Together forever. Leave either one out, and the answer is incomplete and incomprehensible. Wrong.
There are two types of units of measure in science.
Fundamental units: Measurements of length, mass, and time using either the meter-kilogram-second (mks) or centimeter-gram-second (cgs) system. Fundamental units measure space, time, and the amount of matter contained in an object. In this laboratory measurements will be made using centimeters and grams. The first four laboratories will use the "cgs" system of measurement.
Derived units: Measurements expressed using arithmetic combinations of fundamental units. For example, volume is derived from multiplying together three independent measurements of length. To avoid confusion these three measures are usually described as length × width × height. All three are still measures of length. Length is the fundamental measurement. Volume is the derived measurement.
Density is another derived measurement. Density is derived from the mass divided by the volume.
Yet another example of a derived unit is the metric measure of liquid volumes, the liter. A liter is defined to be 1000 cm³. The liter is defined using a fundamental unit of length.
All measurements have limits in terms of their accuracy. There are terms used to describe these limits.
Uncertainty: the limit of our measuring tools for a single measurement, our uncertainty based on the smallest measurement our tools can accurately make. For a ruler marked in millimeters there is always at least a half a millimeter of uncertainty, often more. Some electronic devices tell you the uncertainty. Global positioning satellite (GPS) receivers usually provide an estimated uncertainty.
Precision: the average variation in multiple measurements of an experiment usually expressed using the standard deviation.
Error: the difference between the measured result and the actual value. The actual value is usually unknown, hence the error is never truly known.
Because of uncertainty in primary measurements and error, data is considered linear if the data falls roughly in a straight line. The data does not have to fall exactly in a straight line. The issue of how close data comes to a straight line is part of the study of correlation in statistics.
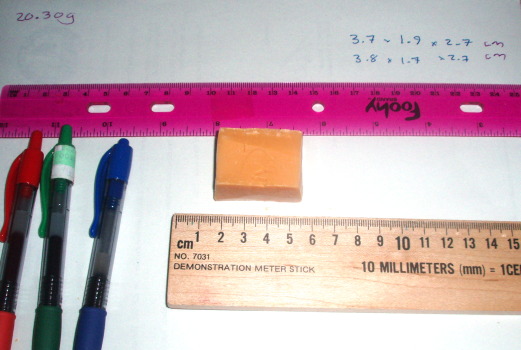
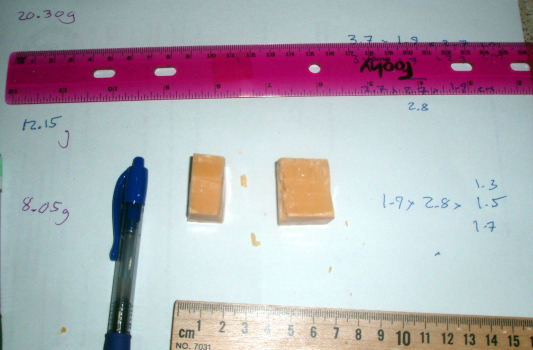
In this laboratory you will explore the relationship between volume and mass for soap. You will measure the length, width, and height of a soap slab, calculate the volume of soap slab, and measure the mass of the soap slab. A graph of volume versus mass will be made. If a relationship is found, then the mathematical equation of the relationship will be calculated. Remember, "a relationship" simply means that a pattern such as a line or curve is formed on an xy scattergraph of the two quantities.
The equation:
mass = density × volume
is of the form
y = mx
where volume is x, mass is y, and the density is the slope m.
The theory behind this laboratory is that the slope of the linear regression line for the volume versus the mass is the density. According to theory, density should be the same for a substance no matter whether the piece is large or small. If this is true, then a plot of volume versus mass should produce a straight line with a slope equal to the density.
In this laboratory the units of mass are grams, the units of volume are cubic centimeters, and the units of density are grams per cubic centimeter.
Length, width, height, and mass are fundamental quantities. Both volume and density are "derived" quantities.


| Length (cm) | Width (cm) | Height (cm) | Volume [x] (cm³) | Mass [y] (g) |
|---|---|---|---|---|
Note: Do not put units into the table. The units are stated in the first row of the table. In a table the units only appear in the first row, the head row.
In the computer laboratory we will make a graph with volume on the x-axis and mass on the y-axis. Then we will run a mathematical decision analysis and make the appropriate calculations of slope and, if appropriate, the y-intercept using a spreadsheet.
Report the mathematical relationship of volume and mass, including both the slope and intercept.
Mathematical relationships allows us to make predictions.
The density of water is close to 1.0 g/cm³ If the density of an object is greater than one, then the object will sink. If the density is less than one, then the object will float. Can you predict whether the soap you carved will float or sink? Why or why not?
Use a spreadsheet and/or word processing package to type up a report with the sections seen above. Include your tables. The class will spend the final portion of the period in A204 to learn how to do this. Laboratory reports are due a week later at the NEXT laboratory period. Laboratory reports submitted after the start of the next laboratory are late. The lab report can be submitted as either a hard copy from a printer or via email. Put your name on the report!
To send a report via email you must attach the report to either your comfsm, yahoo, gmail, or other on line account. Do NOT use "File: Send to" as the report will not get sent anywhere on most college computers. Most on line email systems have a system where you can select an attachment (your report) and then add that attachment to the email.
If you start your report in the A204 computer laboratory and intend to continue work in the library, use "save as" and set the file type to "Excel" The library does not have OpenOffice.org installed as of mid-2008.