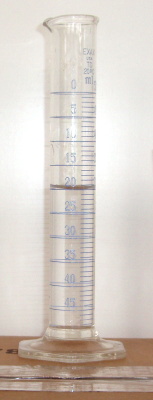
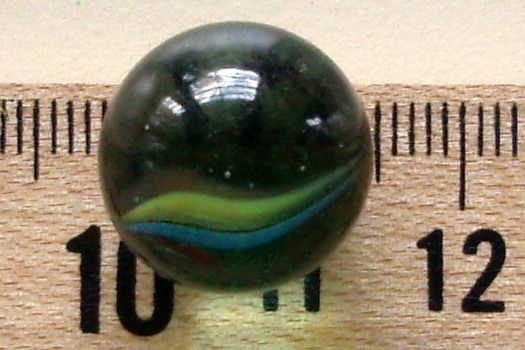
 Measure the diameter of marble.
Nature is an infinite sphere of which the center is everywhere and the circumference nowhere. - Blaise Pascal, Pensées
An attempt at visualizing the Fourth Dimension: Take a point, stretch it into a line, curl it into a circle, twist it into a sphere, and punch through the sphere. - Albert Einstein
To the first order of magnitude, a cow is a sphere. - Anonymous stellar astrophysics professor
Spheres are the mathematical name of three-dimensional shapes where the surface is a constant radius r from a center point. This laboratory explores the relationship between the radius and volume for spheres. The laboratory is very basic and simple. Your task is to design your own tables, make an appropriate graph, and run an analysis on the data. You should also do research to try to determine what theoretic values can be used to determine the error, if any, in your calculations.
The following procedure refers to a duck marble. The procedure applies to any other sphere in the laboratory.
 Measure the diameter of marble.


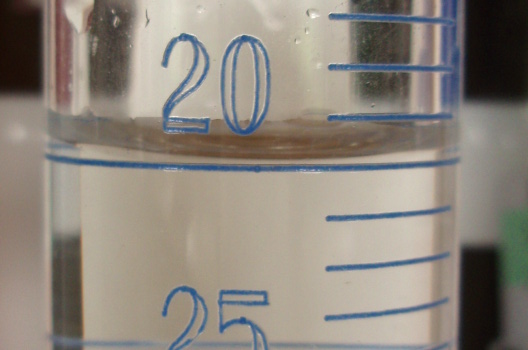
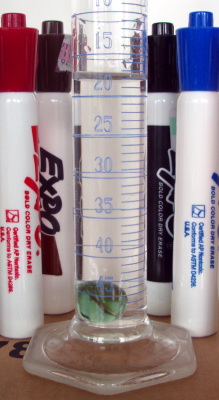
Design your own data tables that report the name of the sphere measured, the diameter in centimeters, the radius in centimeters, the cube of the radius, and the volume of the sphere in milliliters.
Make a graph using an appropriate graph type to display the mathematical relationship, if any, between the cube of the radius r³ and the volume in milliliters.
The analysis should include answers to the following questions:
Wrap up with a conclusion that discusses whether there is a mathematical relationship and, if so, then the nature of that relationship. If you found a theoretic value, explain how you found that value. Discuss the error, if any, between your slope and the theoretic value. Write well. Grammar, vocabulary, organization, and cohesion will still be marked.