- For the Desmos graph and regression, determine the acceleration of the RipStik from a Monday run. Times are in seconds, distances in centimeters.
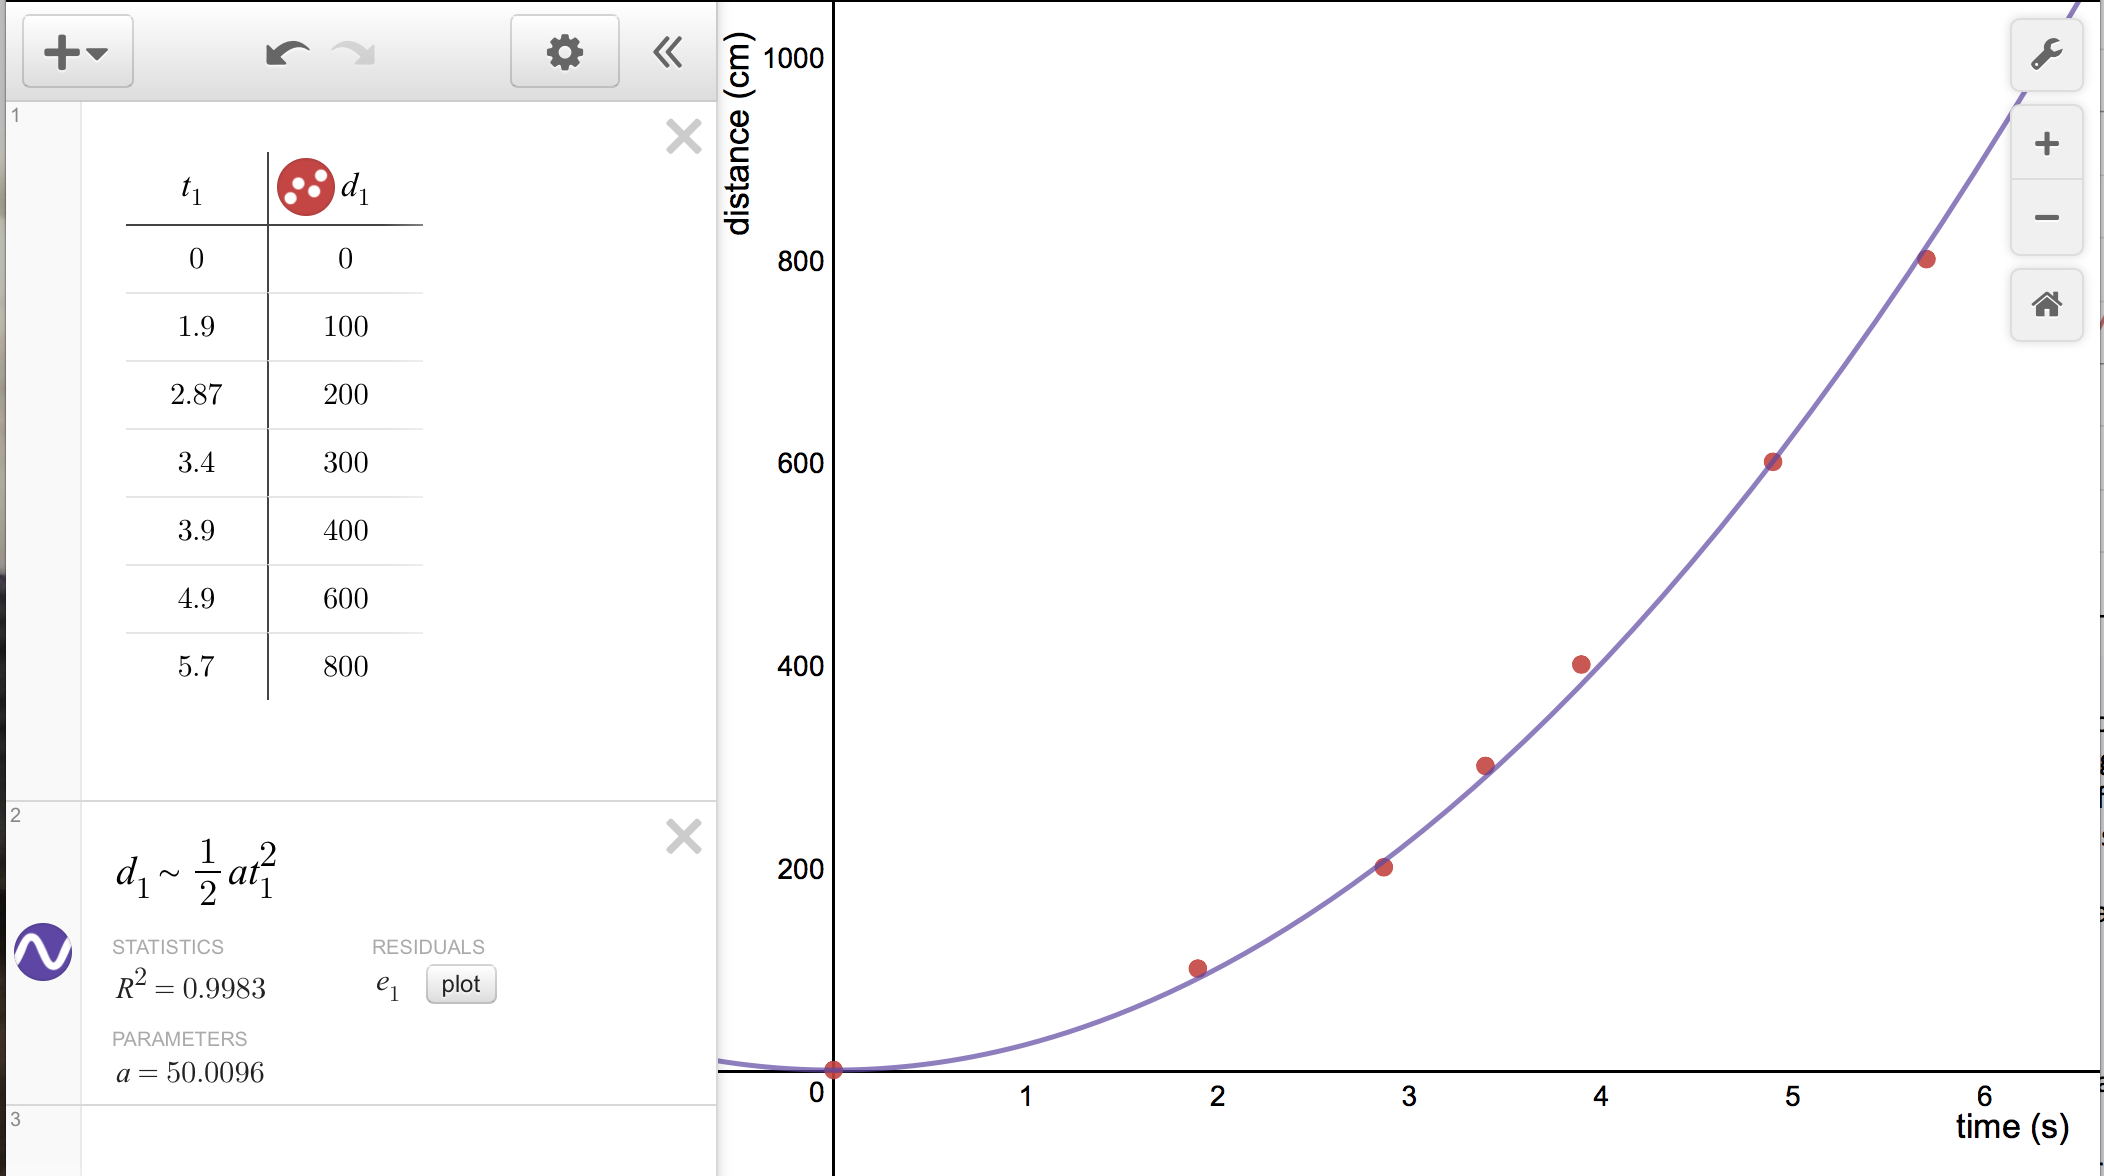
acceleration: __________ __________
- __________ __________ If the RipStik continued to accelerate at the rate above, how far will the RipStik travel in 30 seconds?
- For the Desmos graph and regression, determine the acceleration and initial velocity of the RipStik from a Wednesday run. Times are in seconds, distances in centimeters.
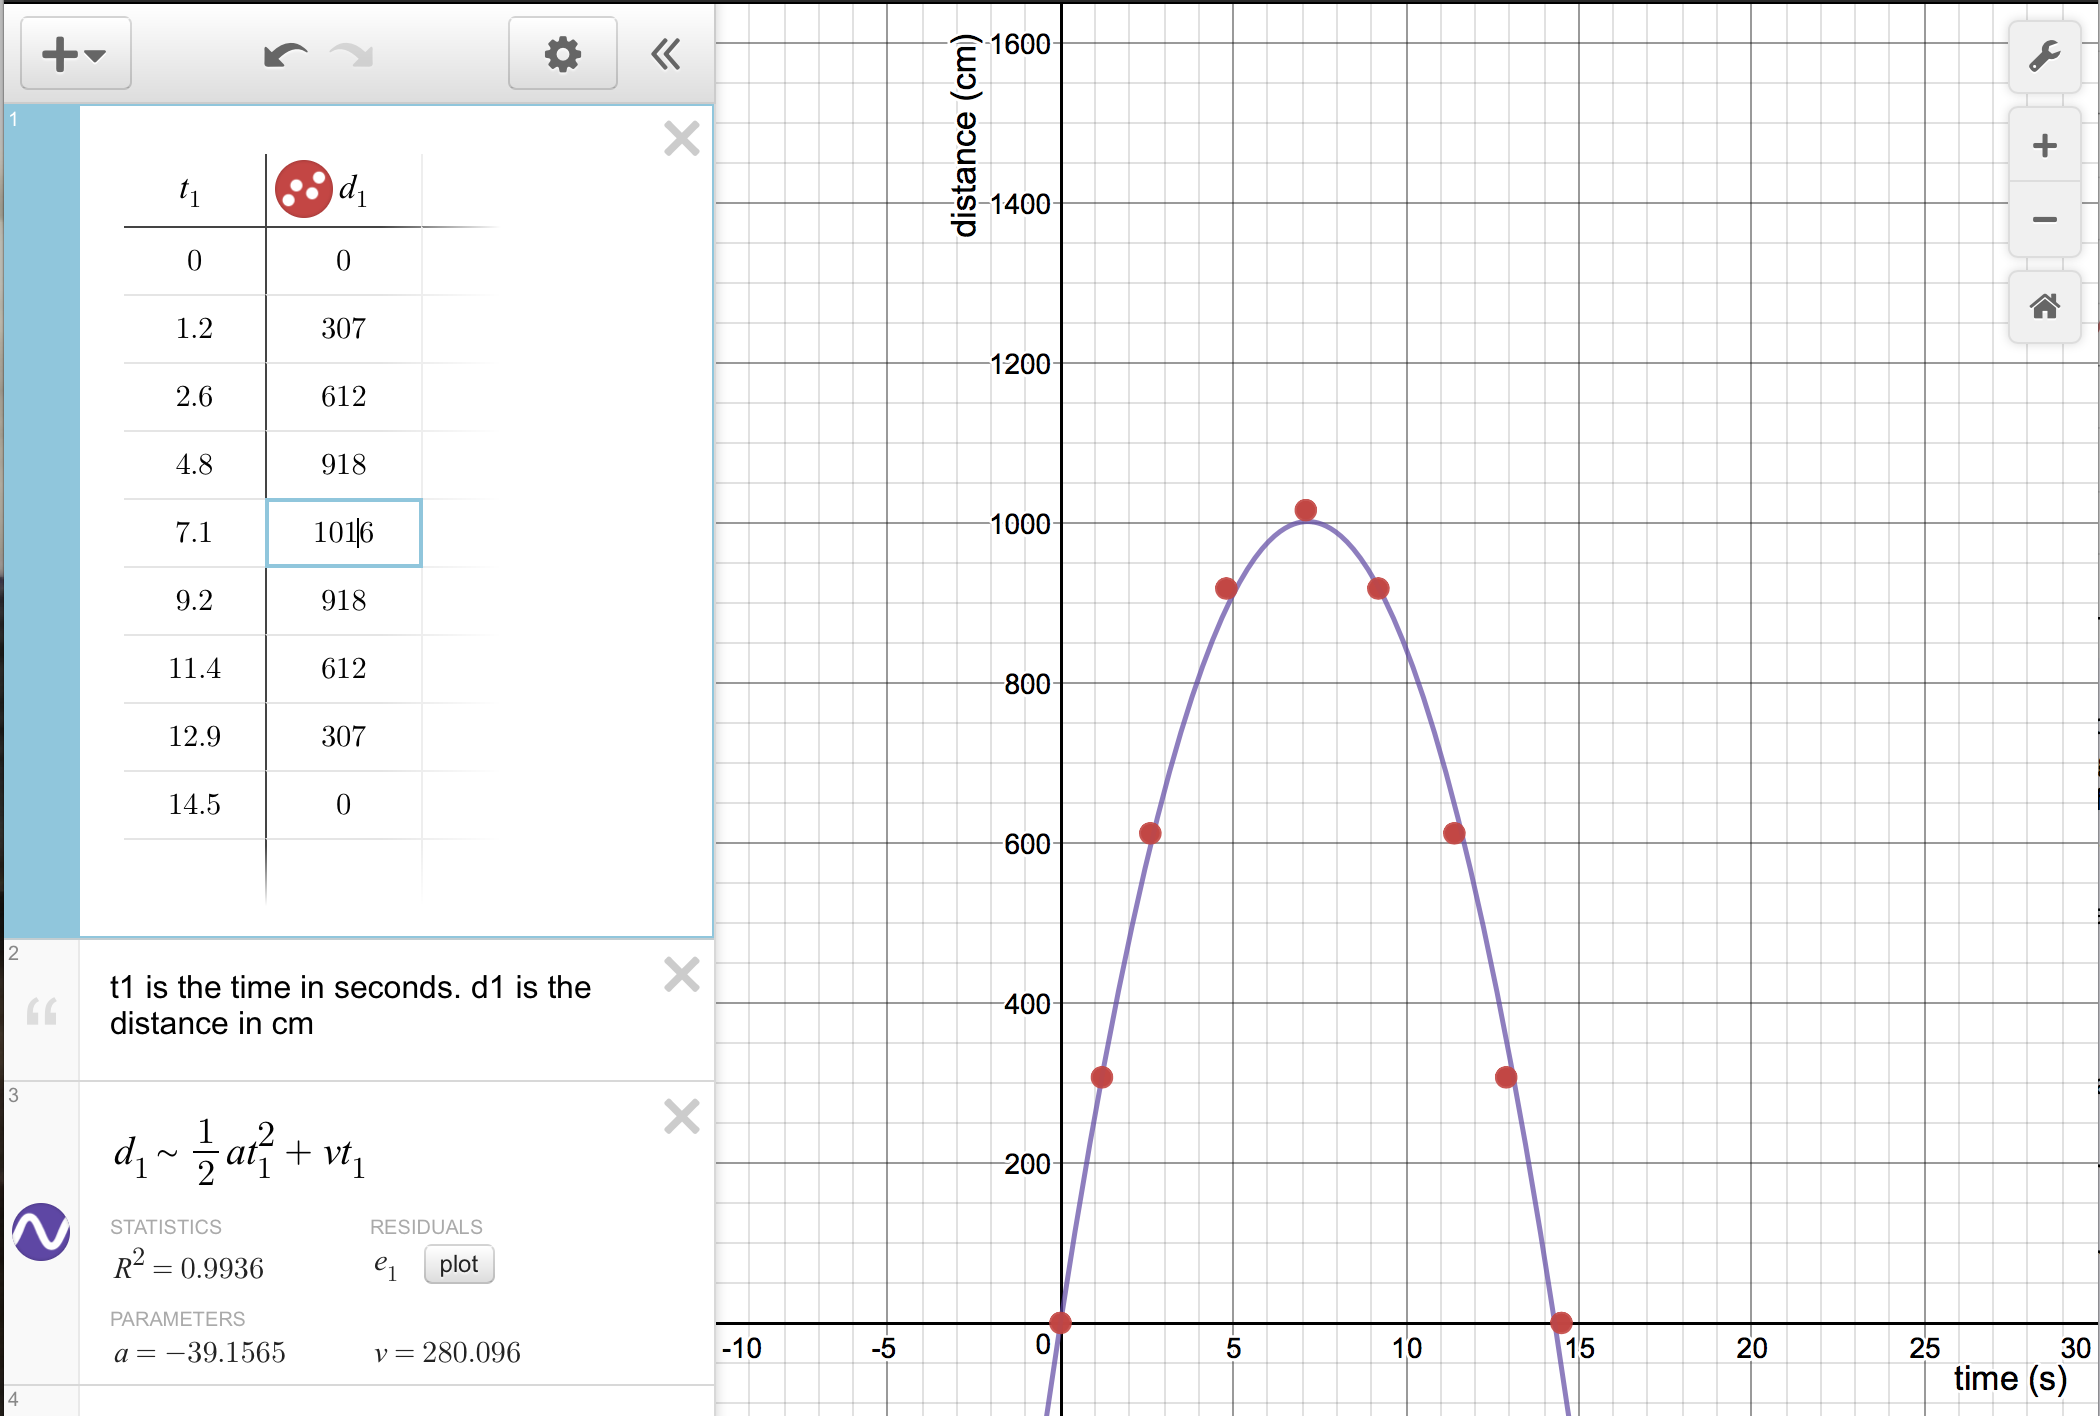
acceleration: __________ __________
initial velocity: __________ __________
- For the Desmos graph and regression, determine the acceleration of gravity from a Thursday laboratory. Times are in seconds, distances in centimeters.
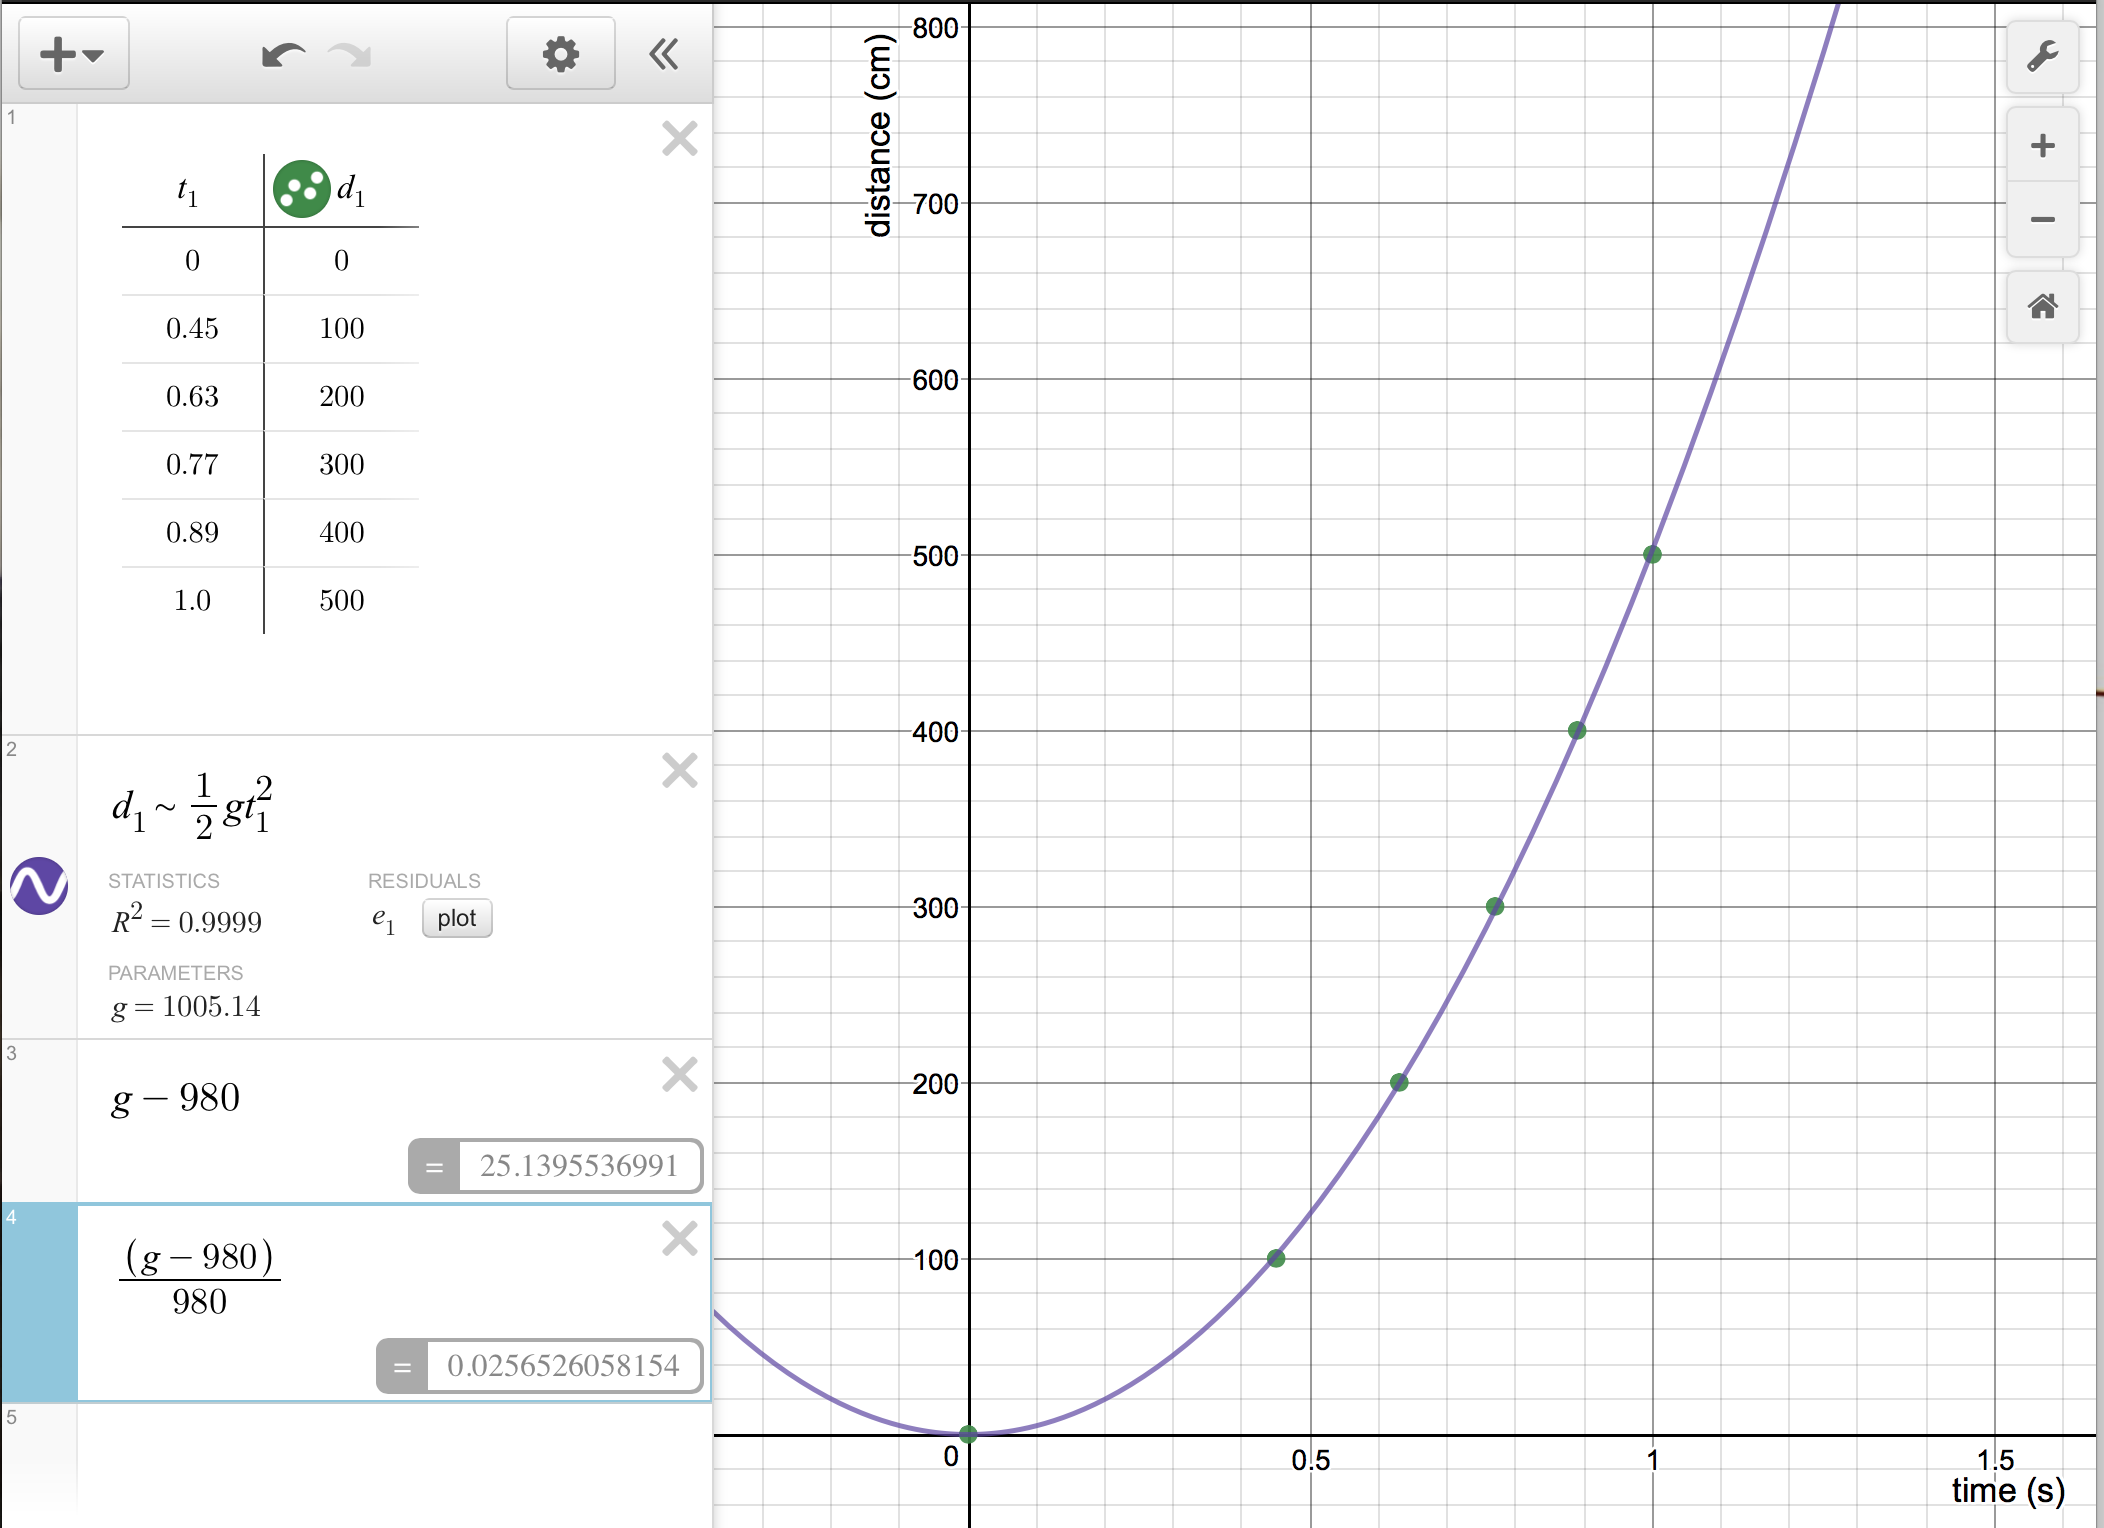
acceleration of gravity: __________ __________
- __________ __________ What is the raw error with respect to the published value of 980 cm/s²?
- ________________ What is the percent error?
- ______________________ How good is the agreement of the experimental value to the published value?
- __________ __________ If the ball continued to fall and accelerate at the rate above, how far will the ball travel in 30 seconds?
ѵ = at
ѵ = gt
d = ½at²
d = ½gt²
where g is the acceleration of gravity
g = 980 cm/s²