Hang a fishing weight or any other compact and dense object by fishing line from a
height such that the maximum length of the pendulum can be on the order of two meters.
Hang them anywhere.
Use any chronograph (timer) that can count seconds: many digital watches have timers built in. If these are not available just use any watch that has a smallest division of seconds and take measurements to the nearest second.
Possible assignments for students in multi-student groups:
| 10t/s | t/s | L/m | t²/s² | *** | 10t/s | t/s | L/m | t²/s² |
|---|---|---|---|---|---|---|---|---|
| ______ | ______ | ______ | ______ | *** | ______ | ______ | ______ | ______ |
| ______ | ______ | ______ | ______ | *** | ______ | ______ | ______ | ______ |
| ______ | ______ | ______ | ______ | *** | ______ | ______ | ______ | ______ |
| ______ | ______ | ______ | ______ | *** | ______ | ______ | ______ | ______ |
| ______ | ______ | ______ | ______ | *** | ______ | ______ | ______ | ______ |
The value of g on planet Earth is roughly 9.8 m/s². Use this value to calculate the percentage error
The equation of the line on the graph is t² = (4p²/g)L. This equation can be used, along with the g determined above, to calculate the period for any length of pendulum.
Values for g from 07 March 2000: 12.7 m/s², 9.4 m/s², 7.5 m/s², 9.3 m/s², 8.3 m/s². Lab section average: 9.44 m/s².
Here is a sample table and sample data and graph, your data and graph will have
different numbers!
| 10t/s | t/s | L/m | t²/s² |
|---|---|---|---|
| 27.24 | 2.724 | 1.890 | 7.42 |
| 24.92 | 2.492 | 1.565 | 6.21 |
| 22.80 | 2.280 | 1.305 | 5.20 |
| 20.47 | 2.047 | 1.045 | 4.19 |
| 17.34 | 1.734 | 0.740 | 3.00 |
| 14.98 | 1.498 | 0.540 | 2.24 |
Sample run: g = 39.5/3.8517 = 10.2 m/s².
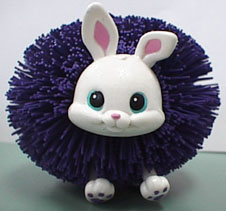
The result should be on the order of 9.8 m/s². The sample data above led to a result that is 5% high. This result is not unreasonable given that the data was gathered by swinging a Kooshkin from a yarn line tied to a ceiling fan.
Computer extension: Use Excel to create the table. Make an XY (Scatter) graph of L versus t². Use the Chart: Add Trendline feature to add a best fit line. In the options one can select to have the equation displayed.
Fun extension: Find a really high place from which to hang a pendulum. A cliff, a palm tree, or a tall building. Do not violate private property laws or endanger yourself or your students. Measure the height. If it is a cliff you can drop a rock and time the fall and reverse engineer the height of the cliff if need be. Or if at the waterfall in Kepar, Kitti, simply toss off the least well behaved student and time their fall (check to make sure they can swim first). Have the students predict the period by calculation based on their lab data. Then time the period.
Keep it simple features:
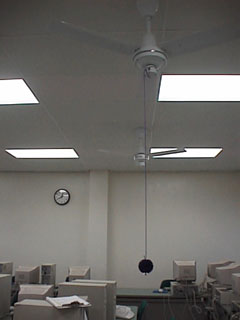
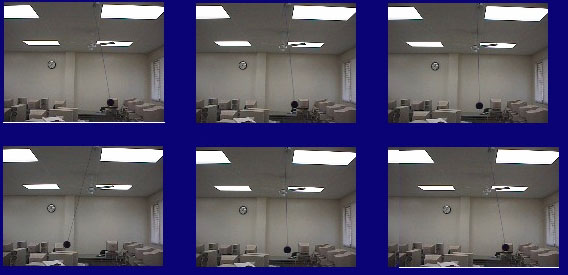
Setup for sample data. A Kooshkin suspended by a yarn line from a ceiling fan.
One period: Successive shots from left to right.
Equipment used in the production of this page was paid for in part by a Title III grant from the United States Department of Education. Development of these laboratories was made possible in part through the cooperation and assistance of the following personnel:
Science PrePilot Investigative Research Team
Brenna Lorenz, University of Guam
Casiano Soram, Pohnpei Islands Central School
Dana Lee Ling, College of Micronesia-FSM
Chuuk Star Support Team
Aier Willyander, FSM Dept. of Education
Joe Habuchmai, College of Micronesia-FSM
Solpisio Salvador, Pohnpei Islands Central School
Note: no kooshkin was harmed in the performance of this lab.
Page comments to Dana Lee Ling
SC 130 Home page
Lee Ling home page
Title III Math/Science Software Specialist
College of Micronesia-FSM
Copyright ©1997 College of Micronesia-FSM.
Laboratory revised: 07 March 2000
http://www.comfsm.fm/~dleeling/physics/pendulum.html