| Statistic or Parameter | Symbol | Equations | Excel |
|---|---|---|---|
| Basic Statistics | |||
| Square root | Ö | =SQRT(number) | |
| Sample size | n | =COUNT(data) | |
| Sample mean | Sx/n | =AVERAGE(data) | |
| Population mean | µ | SX/N | =AVERAGE(populationData) |
| Sample standard deviation | sx or s | =STDEV(data) | |
| Sample Coefficient of Variation | CV | 100(sx/ |
=100*STDEV(data)/AVERAGE(data) |
| Linear Regression Statistics | |||
| Slope | b | =SLOPE(y data, x data) | |
| Intercept | a | =INTERCEPT(y data, x data) | |
| Correlation | r | =CORREL(y data, x data) | |
| Coefficient of Determination | r² | =(CORREL(y data, x data))^2 | |
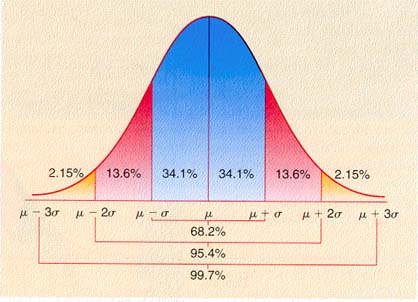
| Normal Statistics | |||
| Calculate a z value from an x | z | = |
=STANDARDIZE(x, m, s) |
| Calculate an x value from a z | x | = s z + m | = s*z+m |
| Calculate a z-statistic from an x | z | |
=( |
| Calculate a t-statistic (tstat) | t | |
=( |
| Calculate an x from a z | =m + zc*sx/sqrt(n) | ||
| Find a probability p from a z value | =NORMSDIST(z) | ||
| Find a z value from a probability p | =NORMSINV(p) | ||
| Confidence interval statistics | |||
| Degrees of freedom | df | = n-1 | |
| Find a zc value from a confidence level c | zc | =ABS(NORMSINV((1-c)/2)) | |
| Find a tc value from a confidence level c | tc | =TINV(1-c,df) | |
| Calculate an error tolerance E of a mean for n ³ 30 using sx | E | =zc*sx/SQRT(n) | |
| Calculate an error tolerance E of a mean for n < 30 using sx. Can also be used for n ³ 30. | E | =tc*sx/SQRT(n) | |
| Calculate a confidence interval for a population mean m from a sample mean x and an error tolerance E | x-E< m <x+E | ||
| Hypothesis Testing | |||
| Calculate t-critical for a two-tailed test | tc | =TINV(a,df) | |
| Calculate t-critical for a one-tailed test | tc | =TINV(2*a,df) | |
| Calculate a p-value from a t-statistic | p | = TDIST(ABS(tstat),df,#tails) | |