MS 150 Statistics Spring 2001 fx
Part I
Use this life expectancy to answer the following questions.
| Location |
Life expectancy
at birth in years |
American
Samoa |
75.1 |
| CNMI |
75.5 |
| Fiji |
67.9 |
| FSM |
68.6 |
| Guam |
77.8 |
| Kiribati |
59.8 |
Marshall
Islands |
65.5 |
| Nauru |
60.8 |
| Palau |
68.6 |
| Samoa |
69.2 |
| Vanuatu |
60.2 |
- _________ Determine the sample size n.
- _________ Calculate the sample mean
 .
.
- _________ Determine the median.
- _________ Determine the mode.
- _________ Calculate the range.
- _________ Calculate the sample standard deviation sx.
- _________ Calculate the sample variance.
- _________ Calculate the Coefficient of Variation.
- Using the intervals specified in the bins column, fill in the frequency and relative
frequency columns of the following table. The number in the bins column is the class upper
limit. Include the class upper limit in each interval.
| Bins |
Frequency |
Relative
Frequency f/n |
| 60 |
_________ |
_________ |
| 65 |
_________ |
_________ |
| 70 |
_________ |
_________ |
| 75 |
_________ |
_________ |
| 80 |
_________ |
_________ |
| Sums: |
_________ |
_________ |
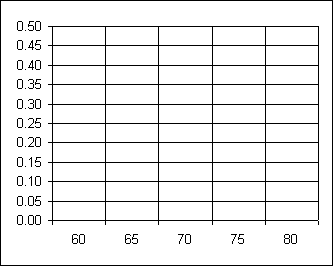
- Draw a histogram of the Relative Frequency data using the following chart:

- _________ What is the shape of the distribution?
- _________ What is the probability that, for the Pacific Island locations above, the life
expectancy will be greater than 60 but less than or equal to 65 years?
- Construct a 95% confidence interval for the population mean m
life expectancy for Pacific Islanders using the above data. Presume for this example
that the data distribution is sufficiently normal. Note that n is less than 30. Use
the sample mean and sample standard deviation to generate your maximal error of
estimate. Show all of your work either below or on the back of this sheet.
Degrees of freedom = __________
T-value = ____________
The maximal Error of Estimate E = _______________
The 95% confidence interval for m is ____________ < m < ____________
- In the following exercise use your sample mean and sample standard deviation as
population parameters. That is, use your calculations in #2 above, the sample mean
 , for the population mean m.
Use your calculations in #6 above, the sample standard deviation sx, for the population
standard deviation s.
Let the null hypothesis H0 be that the average life expectancy is m as calculated by you in question number two above. Suppose in
the year 2001 the actual average life expectancy for these same countries rises to 70
years. At an alpha of 0.05, is this increase in the life expectancy statistically
significantly higher than the present rate?
Do we reject H0 and say the rise is statistically significant or do we fail to
reject H0 and say the change is random at a =
0.05? Note that n is less than 30. Show of your work where appropriate either
here or on the back!
- _______________ What is H0?
- _______________ What is H1?
- __________ What is a?
- __________ What is the t-statistic?
- __________ What is t-critical?
- __________ Do we reject H0?
Part II
For this part use the following data:
| Location |
Per Capita Income
in dollars |
Life expectancy
at birth in years |
| American Samoa |
3300 |
75.1 |
| CNMI |
13100 |
75.5 |
| Fiji |
2000 |
67.9 |
| FSM |
1900 |
68.6 |
| Guam |
20700 |
77.8 |
| Kiribati |
600 |
59.8 |
| Marshall Islands |
1500 |
65.5 |
| Nauru |
9400 |
60.8 |
| Palau |
6400 |
68.6 |
| Samoa |
1300 |
69.2 |
| Vanuatu |
1276 |
60.6 |
- _________ Calculate the slope of the least squares line for the income and life
expectancy data above.
- What does of the sign of the slope tell us about this data? That is, what type of
correlation is this?
- _________ Calculate the linear correlation coefficient r for the income and life
expectancy columns.
- _________ Is the correlation none, low, moderate, high, or perfect?
- _________ Calculate the coefficient of determination.
- What does the coefficient of determination tell us about the relationship between per
capita income and life expectancy?
Life expectancy data is from:http://www.bartleby.com/151/a29.html
and http://www.cia.gov/cia/publications/factbook/geos/cq.html
Income data is from http://www.un.org/Depts/unsd/social/inc-eco.htm
Lee Ling home
COM-FSM home page
