Parameter Statistic Distribution of Statistics The Shape is a Heap! Mu X Bar Central Limit Theorem Standard Deviation Sample mean to z Z to sample mean
A parameter is a numerical description of a population. Examples include the population mean µ and the population standard deviation s.
A statistic is a numerical description of a sample. Examples include a sample mean ![]() and the sample standard deviation sx.
and the sample standard deviation sx.
The distribution of the statistic the sample mean is a normal distribution. That is, if you take random samples of 30 or more elements from a population, calculate the sample mean, and then create a relative frequency distribution for the means, the resulting distribution will be normal.
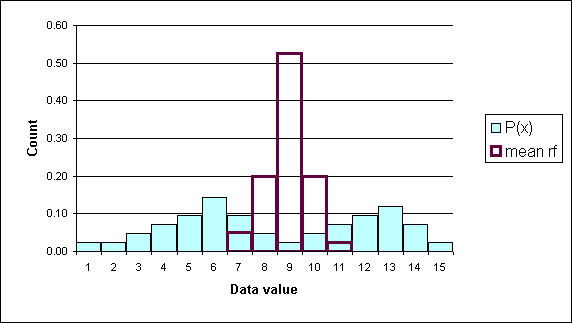
In the following diagram the underlying data is bimodal and is depicted by the light blue columns. Thirty data elements were sampled forty times and forty sample means were calculated. A relative frequency histogram of the sample means is plotted in dark purple (black). Note that though the underlying distribution is bimodal, the distribution of the forty means is "heaped" and close to symmetrical.
The center of the distribution of the sample means is, theoretically, the population mean. To put this another simpler way, the average of the sample averages is the population mean. Actually, the average of the sample averages approaches the population mean as the number of sample averages approaches infinity.
Another Example (2002)
Consider a population consisting of 61 body fat measurements for women at the COM-FSM national campus:
15.6, 18.9, 20, 20.3, 20.6, 20.8, 21.9, 22.1, 22.2, 22.2, 22.4, 22.7, 22.8, 22.8, 23.5, 23.5, 23.6, 23.8, 23.9, 24.3, 24.4, 25.2, 25.2, 25.5, 25.6, 26.1, 26.2, 27.3, 27.5, 27.8, 27.9, 28, 28, 28.1, 28.1, 28.3, 28.4, 29.2, 29.3, 29.3, 29.5, 29.8, 30.5, 31.1, 31.6, 32.9, 34, 34.4, 34.9, 35.5, 35.8, 35.9, 36, 37.5, 38.2, 38.8, 40, 40.8, 44.1, 47, 50.1
The population mean (parameter)for the above data is 28.7. Consider those measurements as being the total population. The distribution of those measurements using an eight bin histogram is seen below.
| Bin | Freq | RelFreq |
|---|---|---|
| 19.9 | 2 | 0.03 |
| 24.2 | 17 | 0.28 |
| 28.5 | 18 | 0.30 |
| 32.9 | 8 | 0.13 |
| 37.2 | 8 | 0.13 |
| 41.5 | 5 | 0.08 |
| 45.8 | 1 | 0.02 |
| 50.1 | 2 | 0.03 |
| 61 | 1.00 |
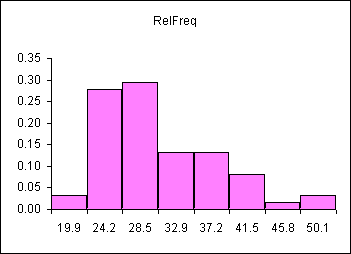
The distribution is skewed right, as seen above.
If we were doing a statistical study, we would measure a random sample of women from the population and calculate the mean body fat for our sample. Then we would use our sample statistic (our sample mean) to estimate the population parameter (the population mean). Understanding the SHAPE of the distribution of many sample means is a key to using a single sample mean (a statistic) to estimate the population mean (a parameter).
The table that follows consists of ten randomly selected samples from the population and the means for each sample. Each sample has a size of n=10 women. The bottom row is the mean of each sample.
| Smpl 1 | Smpl 2 | Smpl 3 | Smpl 4 | Smpl 5 | Smpl 6 | Smpl 7 | Smpl 8 | Smpl 9 | Smpl 10 |
|---|---|---|---|---|---|---|---|---|---|
| 40.8 | 40 | 20.3 | 24.3 | 21.9 | 44.1 | 22.8 | 22.1 | 34.4 | 50.1 |
| 40.8 | 38.2 | 27.3 | 25.2 | 28.3 | 38.2 | 20 | 29.5 | 20.8 | 29.2 |
| 34 | 27.5 | 28 | 35.9 | 27.9 | 29.2 | 38.8 | 25.6 | 31.6 | 35.5 |
| 26.1 | 35.5 | 40 | 23.9 | 23.8 | 22.8 | 24.4 | 22.2 | 38.2 | 28.3 |
| 20.3 | 27.5 | 34.9 | 27.8 | 32.9 | 20.6 | 29.8 | 27.3 | 28.1 | 22.8 |
| 25.2 | 32.9 | 34 | 23.6 | 29.3 | 25.6 | 38.2 | 27.8 | 20.3 | 20.3 |
| 30.5 | 25.6 | 29.3 | 35.5 | 22.4 | 27.8 | 26.2 | 30.5 | 22.7 | 24.4 |
| 37.5 | 40 | 23.9 | 29.5 | 28.4 | 24.4 | 29.2 | 36 | 31.1 | 36 |
| 40 | 34.4 | 28 | 23.6 | 27.8 | 31.1 | 25.2 | 20.8 | 47 | 34 |
| 15.6 | 27.3 | 20.8 | 31.6 | 35.8 | 28 | 35.8 | 31.1 | 22.2 | 22.4 |
| 31.08 | 32.89 | 28.65 | 28.09 | 27.85 | 29.18 | 29.04 | 27.29 | 29.64 | 30.3 |
The mean of the values in the last row is 29.4. This could be called the "mean of the sample means!" A histogram can be used to show the distribution of these sample means. These frequencies and relative frequencies are in the two rightmost columns of the table below.
| Bin | Freq | RelFreq | AvgDist | RFavg |
|---|---|---|---|---|
| 19.9 | 2 | 0.03 | 0 | 0 |
| 24.2 | 17 | 0.28 | 0 | 0 |
| 28.5 | 18 | 0.30 | 3 | 0.3 |
| 32.9 | 8 | 0.13 | 6 | 0.6 |
| 37.2 | 8 | 0.13 | 1 | 0.1 |
| 41.5 | 5 | 0.08 | 0 | 0.0 |
| 45.8 | 1 | 0.02 | 0 | 0.0 |
| 50.1 | 2 | 0.03 | 0 | 0.0 |
| 61 | 1.00 | 10 | 1.00 |
Note that the sample means are clustered tightly about the population mean. This can be seen below where the sample mean distribution is superimposed (placed on top of!) the population distribution.
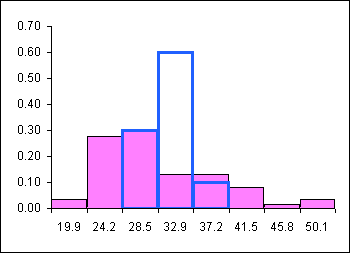
The sample mean distribution is a heap shaped and centered on the population mean. The in-class spreadsheet Excel has a tab where batches of ten random samples can be taken over and over and the shape of the sample means is automatically displayed. Check it out, you always get a heap! The data is skewed but the distribution of the means is not. Heaps rule! Heaps are normal! Life is good: we get to use our normal statistics tools to work with sample means.
Because the sample means are NORMALLY distributed even when the underlying data is NOT normally distributed!
The mean of the sample means can be written as:
![]()
The value of the mean of the sample means is, for a very large number of samples each of which has a very large sample size, is the population mean. As a practical matter we use the mean of a single large sample. How large? The sample size must be at least n=30 in order for the sample mean (a statistic) to be a good estimate for the population mean (a parameter).
The Central Limit Theorem is the theory that says "for increasingly large sample sizes n, the sample mean approaches ever closer the population mean."
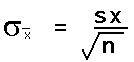
There is one complication: the sample standard deviation of a single sample is not a good estimate of the standard deviation of the sample means. Note that the distribution of the sample means was NARROWER than the sample: the standard deviation of a single sample has to be reduced to reflect this.
The standard deviation of the distribution of the sample means is equal to the actual population standard deviation divided by the square root of n.
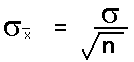
As a practical matter, since we rarely know the population standard deviation, we will use the sample standard deviation in class to estimate the standard deviation of the sample means. This formula will then appear in various permutations in formulas used to estimate a population mean from a sample mean.
This will have the following impact on the formulas we used in the previous chapter.
Calculations of z based on a sample mean:

Calculations of the sample mean based on a z-value:
![]() =
= ![]()
Work number 6 p334.
Population mean 68, stdev 3. P(67<x<69).
n=9, P(67<![]() <69)
<69)