| Images | Horsepower | Price |
|---|---|---|
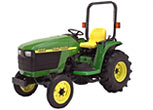 |
26 | 13600 |
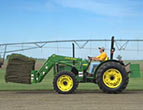 |
48 | 19300 |
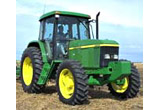 |
95 | 46300 |
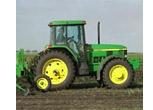 |
105 | 60315 |
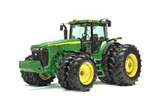 |
255 | 168900 |
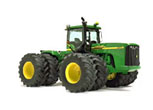 |
450 | 200100 |
- Determine the slope m
- For the data above, determine the y-intercept
- Determine the correlation coefficient r =
- Is the correlation positive, negative, or neutral?
- Is the correlation none, low, moderate, high, or perfect?
- Determine the coefficient of determination
- Based on the equation of the best fit line, what would be the predicted price for a 55
horsepower tractor?
- Based on the equation of the best fit line, what would be the projected horsepower of a
$100,000 dollar tractor?
20, 20, 32, 32, 35, 39, 40, 43, 43, 45, 45, 48, 48, 55, 55, 55, 65, 65, 65, 75, 75, 75
- Find the sample size n: ______
- Find the minimum: ______
- Find the maximum: ______
- Find the range: ______
- Find the median: ______
- Find the mode: ______
- Find the sample mean
 : ______
 - Find the sample standard deviation sx: ______
- Find the sample coefficient of variation CV:______
- If this data is to be divided into five bins (classes, intervals) what is the width of a
single bin? ________
- Determine the frequency and calculate the relative frequency using five bins (classes,
intervals). Record your results in the table provided.
Bins ( Classes or Intervals) Frequency Relative Frequency _______ _______ _______ _______ _______ _______ _______ _______ _______ _______ _______ _______ _______ _______ _______ Sum:
_______________ _______________ - Sketch a relative frequency histogram of the data on the back, labeling your horizontal
axis and vertical axis as appropriate.
- What is the shape of the distribution? ______________
- What is the probability of a tractor having between 20 and 31 horsepower?
- What is the probability of a tractor having between either 20 and 31 horsepower or 32
and 42 horsepower.