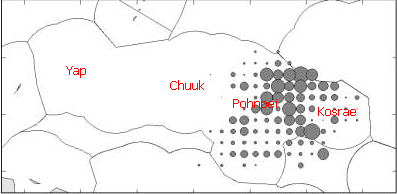
Aside from money received from the United States of America through the Compact of Free Association, the other major contributor to the Gross National Product of the Federated States of Micronesia is fisheries, primarily tuna fisheries. The largest tonnages are for skipjack tuna caught by purse seiners for the canned tuna market. Many nations have boats involved in skipjack purse seiner fisheries. From 1992 to 2000 the total tonnage of skipjack tuna caught by FSM owned purse seiners was as follows:
Year | Skipjack/tonnes | Year | Skipjack/tonnes |
---|---|---|---|
1992 | 11657 | 1997 | 5501 |
1993 | 11692 | 1998 | 11314 |
1994 | 17351 | 1999 | 6972 |
1995 | 4216 | 2000 | 15843 |
1996 | 6745 |
Bins | Frequency | Relative Frequency f/n |
---|---|---|
_________ | _________ | _________ |
_________ | _________ | _________ |
_________ | _________ | _________ |
_________ | _________ | _________ |
_________ | _________ | _________ |
Sums: | _________ | _________ |
The data below represents the catch per unit effort for skipjack tuna caught by FSM owned purse seiners from 1992 to 2001. The catch per unit effort (CPUE) is the total tonnage of tuna caught divided by the total numbers of days fished and searched. In the table below 1992 is the "base year". 1992 is year 0, 1993 is year 1, 1994 is year 2, and so forth with 2001 being year 9. 2002 would be year 10 in this system.
Year | Skipjack CPUE |
---|---|
0 | 14.67 |
1 | 10.14 |
2 | 11.72 |
3 | 8.62 |
4 | 14.32 |
5 | 9.76 |
6 | 15.59 |
7 | 12.36 |
8 | 17.33 |
9 | 11.99 |
Basic Statistics | |||
---|---|---|---|
Statistic or Parameter | Symbol | Equations | Excel |
Square root | =SQRT(number) | ||
Sample size | n | =COUNT(data) | |
Sample mean | x | Sx/n | =AVERAGE(data) |
Sample standard deviation | sx or s | =STDEV(data) | |
Sample Coefficient of Variation | CV | 100(sx/x) | =100*STDEV(data)/AVERAGE(data) |
Linear Regression Statistics | |||
---|---|---|---|
Statistic or Parameter | Symbol | Equations | Excel |
Slope | b | =SLOPE(y data, x data) | |
Intercept | a | =INTERCEPT(y data, x data) | |
Correlation | r | =CORREL(y data, x data) | |
Coefficient of Determination | r2 | =(CORREL(y data, x data))^2 |
Statistic or Parameter | Symbol | Equations | Excel |
---|---|---|---|
Normal Statistics | |||
Calculate a z value from an x | z | = | =STANDARDIZE(x, µ, s) |
Calculate an x value from a z | x | = s z + µ | =s*z+µ |
Calculate a z-statistic from an x | z | =(x - µ)/(sx/SQRT(n)) | |
Calculate a t-statistic (t-stat) | t | =(x - µ)/(sx/SQRT(n)) | |
Calculate an x from a z | =µ + zc*sx/sqrt(n) | ||
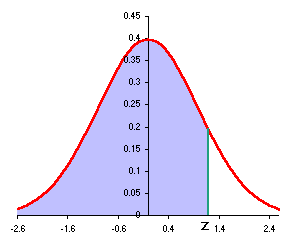
Find a probability p from a z value | =NORMSDIST(z) | ||
Find a z value from a probability p | =NORMSINV(p) | ||
Confidence interval statistics | |||
Degrees of freedom | df | = n-1 | =COUNT(data)-1 |
Find a zc value from a confidence level c | zc | =ABS(NORMSINV((1-c)/2)) | |
Find a tc value from a confidence level c | tc | =TINV(1-c,df) | |
Calculate an error tolerance E of a mean for n >= 30 using sx | E | =zc*sx/SQRT(n) | |
Calculate an error tolerance E of a mean for n < 30 using sx. Can also be used for n >= 30. | E | =tc*sx/SQRT(n) | |
Calculate a confidence interval for a population mean µ from a sample mean x and an error tolerance E | x-E<= µ <=x+E | ||
Hypothesis Testing | |||
Calculate t-critical for a two-tailed test | tc | =TINV(a,df) | |
Calculate a p-value from a t-statistic | p | = TDIST(ABS(tstat),df,#tails) |