| Images |
Horsepower |
Price/1000s |
 |
275 |
155 |
 |
300 |
175 |
 |
350 |
230 |
 |
365 |
240 |
 |
400 |
280 |
 |
525 |
280 |
 |
650 |
400 |
 |
760 |
450 |
 |
1050 |
600 |
 |
1775 |
1000 |
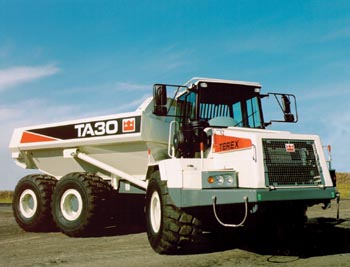
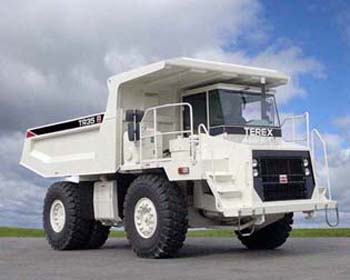
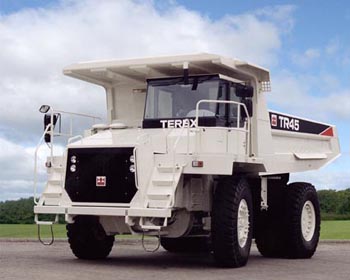
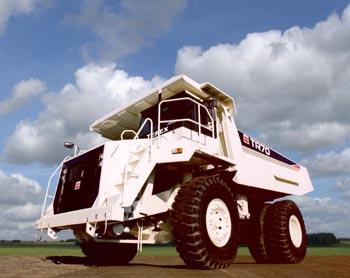
For this midterm all questions use the data given in the table containing information about Terex off highway dump trucks. The Terex line of off highway dump trucks runs from a 275 horsepower articulated dump truck for $155,000 to a 1775 horsepower rigid frame truck $1,000,000. The y-data given in the table is in 1000's of dollars.
Perform a linear regression for the accompanying Terex Off Highway Trucks using horsepower versus price data.
- Calculate the slope of the best fit line for the horsepower and
price data
- Calculate the y-intercept for the data
- Is the correlation positive, negative, or neutral?
- Determine the correlation coefficient
- Is the correlation none, low, moderate, high, or perfect?
- Determine the coefficient of determination
- What percent in the variation in horsepower explains the variation
in price?
- Based on the equation of the best fit line, what would be the
predicted price in dollars for a 900 horsepower truck?
- Based on the equation of the best fit line, what would be the
projected horsepower of a $300,000 dollar truck? Remember that your
y-axis is in 1000's of dollars.
Use the horsepower data to perform the following
calculations:
- Find the sample size n:
- Find the minimum horsepower:
- Find the maximum horsepower:
- Find the range horsepower:
- Find the median horsepower:
- Find the mode horsepower:
- Find the sample mean horsepower:
- Find the sample standard deviation horsepower:
- Find the sample coefficient of variation CV:
- If this data is to be divided into four bins what is the width
of a single bin?
- Determine the frequency and calculate the relative frequency using
four bins. Record your results in the table provided.
| Bins (x) |
Frequency (f) |
P(x) |
| _______ |
_______ |
_______ |
| _______ |
_______ |
_______ |
| _______ |
_______ |
_______ |
| _______ |
_______ |
_______ |
Sum: |
_______________ |
_______________ |
- Sketch a relative frequency histogram of the data here below or
on the back, labeling your horizontal axis and vertical axis as
appropriate.
- What is the shape of the distribution?
- Determine P(650 < horsepower <= 1025)
- Determine P(x > 1025)
| Statistic or Parameter |
Symbol |
Equations |
Excel |
| Square root |
|
|
=SQRT(number) |
| Sample mean |
 |
Sx/n |
=AVERAGE(data) |
| Sample standard deviation |
sx |
|
=STDEV(data) |
| Sample Coefficient of Variation |
CV |
100(sx/) |
=100*STDEV(data)/AVERAGE(data) |
| Slope |
b |
|
=SLOPE(y data, x data) |
| Intercept |
a |
|
=INTERCEPT(y data, x data) |
| Correlation |
r |
|
=CORREL(y data, x data) |
| Coefficient of Determination |
r² |
|
=(CORREL(y data, x data))^2 |
Statistics home Lee Ling home
COM-FSM home page