MS 150 Statistics Spring 2003 Quiz 3 • Name: ________________
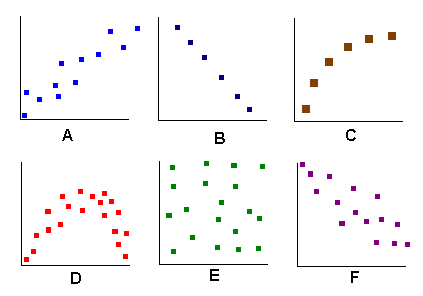
For the following six graphs, determine whether the relationship is linear,non-linear, or random; and, if linear, determine whether it is positive or negative.

- ______________________________
- ______________________________
- ______________________________
- ______________________________
- ______________________________
- ______________________________
Use the following data for this quiz
| Year, where 1995 is year 0 (x) |
Number of students in nursing program (y) |
| 0 | 44 |
| 2 | 28 |
| 4 | 18 |
| 6 | 3 |
- __________ Calculate the slope of the best fit (also known at least squares) line for the data.
- __________ Calculate the y-intercept of the best fit line.
- ______________ Is the correlation positive, negative, or neutral?
- _______ How many nurses were predicted to be in the program in 2000 (x=5)?
- _______ What year was the program predicted to have 12 nurses?
- _______ What year was the program predicted to have zero nurses?
- _______ How many nurses are predicted to be in the program by the best fit line in 2005?

