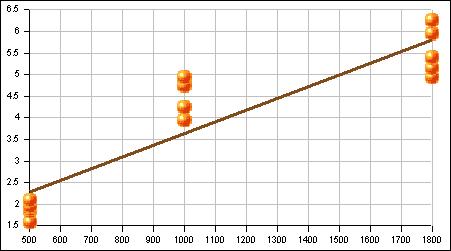
| Yamasa Soy Sauce Data Fall 2002 |
|
|

|
| Store |
Vol/ml |
Price |
| Ace Commercial |
500 |
1.6 |
| Bamboo Inn |
500 |
1.85 |
| Josaiah |
500 |
1.9 |
| Panuelo |
500 |
1.95 |
| En's 7 Star |
500 |
2.1 |
| Ace Commercial |
1000 |
3.95 |
| 4TY |
1000 |
4.25 |
| Panuelo |
1000 |
4.75 |
| En's 7 Star |
1000 |
4.95 |
| Ace Commercial |
1800 |
4.95 |
| Panuelo |
1800 |
5.15 |
| Wall Mart |
1800 |
5.4 |
| 4TY |
1800 |
5.95 |
| En's 7 Star |
1800 |
6.25 |
|
14 |
14 |
What is the sample size n? |
|
1107.14 |
3.93 |
What is the mean price? |
|
574.41 |
1.69 |
What is the sample standard deviation of the price? |
|
0.52 |
0.43 |
What is the sample coefficient of variation for the price? |
|
0.002697 |
|
Calculate the slope of the best fit (also known at least squares) line for the data. |
|
0.94 |
|
Calculate the y-intercept of the best fit line. |
|
positive |
|
Is the correlation positive, negative, or neutral? |
|
$4.99 |
|
What is the predicted price of a 1500 ml bottle of Yamasa soy sauce? |
|
762.81 |
|
What is the predicted volume of a $3.00 bottle of Yamasa soy sauce? |
|
0.9168 |
|
Calculate the linear correlation coefficient r for the data. |
|
high |
|
Is the correlation none, low, moderate, high, or perfect? |
|
0.8405 |
|
Calculate the coefficient of determination. |
|
84.05% |
|
What percent of the variation in volume explains the variation in price? |

