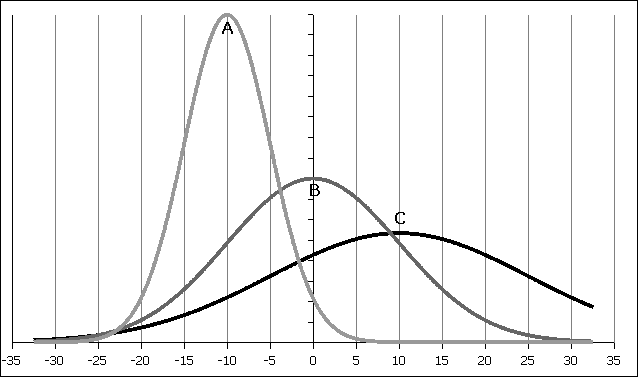
1. For the following curves A, B, and C determine the mean µ and the standard deviation
σ:
| Curve | Mean µ | standard deviation σ |
|---|---|---|
| A | ||
| B | ||
| C |
2. According to a presentation on the Asian Development Bank Economic Report on the FSM done in 2005, investment in the fishing industry, primarily tuna fishing, by the FSM resulted in a mean loss µ of 3.874 million dollars per year with a standard deviation σ of 2.938 million dollars per year. Presume that the data is normally distributed.
| Normal Statistics | |||
|---|---|---|---|
| Calculate a z value from an x | z | = |
=STANDARDIZE(x, µ, σ) |
| Calculate an x value from a z | x | = z σ + µ | =z*σ+µ |
| Find a probability p(x) from a z value where the probability p is the area to the left of z. | =NORMSDIST(z) | ||
| Find a z value from a probability p, where p is the area to the left of z | =NORMSINV(p) | ||