Data set two: Sakau market ratings (cups until sakaula):
Pwopwida:
6-11:
Data set three: Prices of ramen in cents: 25, 35, 55, 100
For each type of data shown write the appropriate measure of the middle and, if any, the appropriate measure of the spread of the data. For each data type, determine the appropriate value for the middle. Think of this problem this way: imagine a friend has brought the following three sets of data to you and asks you to determine the middle and spread.
Data set one: Favorite colors: blue, red, orange, yellow, green, cyan, blue, indigo, purple, violet, magenta, blue
Data set two: Sakau market ratings (cups until sakaula):
Pwopwida:
![]()
![]() |
Song ie mahs:
|
Song ie mahs:
![]()
![]()
![]() |
Stroke:
|
Stroke:
![]()
![]()
![]()
![]()
6-11:
![]()
![]()
![]()
![]()
![]() |
No choice:
|
No choice:
![]()
![]()
![]()
![]()
![]()
![]()
![]()
![]()
![]()
![]()
Data set three: Prices of ramen in cents: 25, 35, 55, 100
| Data set | Level of measurement | Appropriate function to measure middle | Value of the middle measure | Appropriate function to measure spread | Value of the spread measure |
|---|---|---|---|---|---|
| 1. | nominal | mode | blue | (none) | (n/a) |
| 2. | ordinal | median | range | ||
| 3. | ratio | mean | 53.75 | stdev | 33.26 |
| Favorite Number |
|---|
| 6 |
| 13 |
| 2 |
| 3 |
| 5 |
| 1 |
| 8 |
| 17 |
| 3 |
| 5 |
| 7 |
| 5 |
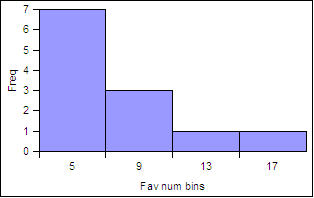
For the favorite number data seen at the left:

| Bins | Frequency | Relative Frequency |
|---|---|---|
| 5 | 7 | 0.58 |
| 9 | 3 | 0.25 |
| 13 | 1 | 0.08 |
| 17 | 1 | 0.08 |
| Sums: | 12; | 1.00 |