| x | y |
|
||||
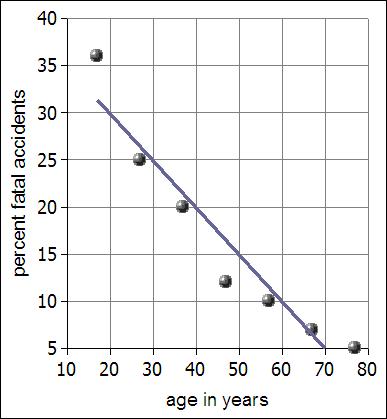
| 17 | 36 | |||||
| 27 | 25 | |||||
| 37 | 20 | |||||
| 47 | 12 | |||||
| 57 | 10 | |||||
| 67 | 7 | |||||
| 77 | 5 | |||||
| Pearson correlation coefficient | -0.96 | |||||
| Coefficient of determination is r² | 92.04% | |||||
| 92% of the variation in age "explains" or "accounts for" the variation in the percent of fatal accidents | ||||||
| 8% is not explained by a linear regression | ||||||
| slope | -0.5 | |||||
| intercept | 39.76 | |||||
| lowest pressure | Maximum wind speed | 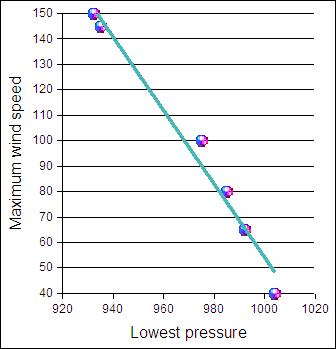
|
|||
| 1004 | 40 | ||||
| 975 | 100 | ||||
| 992 | 65 | ||||
| 935 | 145 | ||||
| 985 | 80 | ||||
| 932 | 150 | ||||
| Pearson correlation coefficient | -0.99 | ||||
| Coefficient of determination is r² | 97.96% | ||||
| 98% of the variation in pressure explains the max wind speed | |||||
| 8% is not explained by a linear regression | |||||
| slope | -1.44 | ||||
| The lower the pressure, the | intercept | 1496.78 | |||
| higher the wind speed! | |||||