Test two summer 2007 • Basic statistics • Name:

Golf ball
Bounce/cm
72
73
77
77
77
78
80
81
82
83
83
84
84
86
87
88
91
109

A golf ball was dropped and bounce heights in centimeters were measured as seen in the table. Use the data in the table to answer the following questions.

  1. __________ What is the level of measurement?
  2. __________ Find the sample size n.
  3. __________ Find the minimum.
  4. __________ Find the maximum.
  5. __________ Find the range.
  6. __________ Find the mode.
  7. __________ Find the median.
  8. __________ Find the sample mean x.
  9. __________ Find the sample standard deviation sx.
  10. __________ Find the sample coefficient of variation CV.
  11. z = __________ Use the formula z = (x − x)/sx to find the z-score for a bounce of 72 cm. Use the sample mean and sample standard deviation from above.
  12. _________________ Is a bounce of 72 cm an ordinary or an unusual bounce value?
  13. z = __________ Find the z-score for a bounce of 109 cm.
  14. _________________ Is a bounce of 109 cm an ordinary or an unusual bounce value?

Linear regression

golfball_successivebounce (11K)

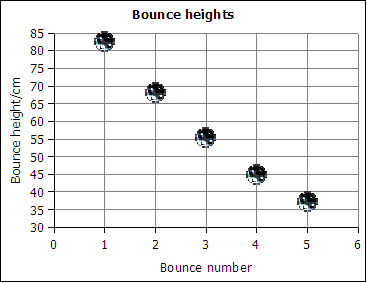
Superball
Bounce number (x)Bounce height/cm (y)
182
268
355
445
537
632
  1. ______________ Determine the slope of the best fit line for the data.
  2. ______________ Determine the y-intercept of the best fit line for the data.
  3. ______________ Use the slope and intercept above to calculate the predicted bounce height for the seventh bounce.
  4. ______________ Use the slope and intercept to solve for the predicted bounce number that will produce a bounce of 7.8 cm.
  5. Toughie critical thinking question: The y-intercept is a height in centimeters. What is the meaning of this height?
Linear Regression Functions
Statistic or ParameterMath symbolStat symbolOpenOffice
Slopemb=slope(y-data;x-data)
Interceptba=intercept(y-data;x-data)
Correlation r=correl(y-data;x-data)
Coefficient of Determination r2 =(correl(y-data;x-data))^2