Linear regression trend line attendance versus performance in course
Review of performance: MS 150 Spring 2009. 56 students enrolled in course. Submitted by Dana Lee Ling
| n | SLO | Program SLO | I, D, M | Reflection/comment | |
|---|---|---|---|---|---|
| 1 | Identify levels of measurement and appropriate statistical measures for a given level | define mathematical concepts, calculate quantities, estimate solutions, solve problems, represent and interpret mathematical information graphically, and communicate mathematical thoughts and ideas. | M | 52 | of 56 students were successful on this SLO based on an item analysis of the comprehensive final examination |
| 2 | Determine frequencies, relative frequencies, creating histograms and identifying their shape visually | M | 42 | ||
| 3 | Calculate basic statistical measures of the middle, spread, and relative standing | M | 48 | ||
| 4 | Perform linear regressions finding the slope, intercept, and correlation; generate predicted values based on the regression | M | 35 | ||
| 5 | Calculate simple probabilities for equally likely outcomes | M | 48 | ||
| 6 | Determine the mean of a distribution | M | 48 | ||
| 7 | Calculate probabilities using the normal distribution | M | 48 | ||
| 8 | Calculate the standard error of the mean | M | 48 | ||
| 9 | Find confidence intervals for the mean | M | 37 | ||
| 10 | Perform hypothesis tests against a known population mean using both confidence intervals and formal hypothesis testing | M | 30 | ||
| 11 | Perform t-tests for paired and independent samples using both confidence intervals and p-values | M | 23 | ||
Performance in MS 150 Statistics is measured by quizzes and tests throughout the term. A comprehensive final examination consisting of fifty fill-in-the-blank questions was administered. The fifty questions each map back to a course level student learning outcome. Performance against the outline proposed in 2008 has been measured for the past two terms and provides a basis for comparison across the terms. The following table indicates the average percent of the number of student who answered questions in a particular area correctly.
| Outnum | Students will be able to: | Sp 08 | Fa 08 | Sp 09 |
|---|---|---|---|---|
| 1 | Identify levels of measurement and appropriate statistical measures for a given level | 78% | 82% | 94% |
| 2 | Determine frequencies, relative frequencies, creating histograms and identifying their shape visually | 83% | 84% | 75% |
| 3 | Calculate basic statistical measures of the middle, spread, and relative standing | 90% | 80% | 86% |
| 4 | Perform linear regressions finding the slope, intercept, and correlation; generate predicted values based on the regression | 80% | 79% | 63% |
| 5 | Calculate simple probabilities for equally likely outcomes | N/A | N/A | N/A |
| 6 | Determine the mean of a distribution | N/A | N/A | N/A |
| 7 | Calculate probabilities using the normal distribution | N/A | N/A | N/A |
| 8 | Calculate the standard error of the mean | 84% | 84% | 87% |
| 9 | Find confidence intervals for the mean | 66% | 85% | 67% |
| 10 | Perform hypothesis tests against a known population mean using both confidence intervals and formal hypothesis testing | 36% | 56% | 55% |
| 11 | Perform t-tests for paired and independent samples using both confidence intervals and p-values | 55% | 63% | 43% |
| 12 | Go beyond outline | 33% | 16% | |
| PSLO | define mathematical concepts, calculate quantities, estimate solutions, solve problems, represent and interpret mathematical information graphically, and communicate mathematical thoughts and ideas. | 72% | 76% | 69% |
Sp 08 refers to performance on the spring 2008 final examination, Fa 08 to performance on the fall 2008 final examination, and Sp 09 refers to performance on the current term final examination. Performance marked N/A indicates that the material was not directly performed on the final examination. Material in those sections was tested during the term and is foundation material to that tested in later chapters.
Overall performance levels remained stable in each area, fairly typical for a mature course that is in its ninth year and nineteenth running. There are indications that performance on the final this term was slightly lower than previous terms. Of note was that the 8:30 section, which took the final on Tuesday 05 May attained an average of 71% while the the 9:30 section which took the exact same test two days later attained a 67% average. The expectation would be that the 9:30 students would have a couple days to determine the material on the final and prepare with foreknowledge. There is no indication that this occurred.
The final five questions on the final examination are from material beyond the outline. The students are unaware that this material will appear, the material is not covered in the textbook, and the material is deleted from the posted finals that students use to study for the examination. This material is a complete surprise to the students. The point of this material is noted on the final examination itself, "One intention of any course is that a student should be able to learn and employ new concepts in the field even after the course is over."
The 16% success rate of students on this material is not that encouraging. Although the material builds on ideas that the students have encountered, only one student in six successfully answered the questions in this material.
Students show strength in the ability to make basic calculations. The success rate on basic statistics was 86%, with a 75% success rate on making a histogram. The more complex operation of calculating a confidence interval saw a 67% success rate.
Using the underlying item analysis, the area of greatest weakness was rawing conclusions from the data, making inferences and correct interpretations of the results. Questions that required an inference, an interpretation of a result, had only a 40% success rate. The low performance on inferences has existed in previous terms, but as success rates on basic calculations have improved, the lower performance on inferences becomes increasingly apparent. Underneath the lower success rate is a lack of understanding as to the "meanings" behind the numbers. Improving student ability to make inferences is an area in which I have yet to find a way to improve student performance. This remains a challenge.
For a third term in a row students were asked to engage in putting together a basic statistical research project. The number of projects completed improved with the addition of an earlier (fourth week of class) initial commitment to a project idea. Writing on the projects also showed improvement, but this was not specifically analyzed this term.
The college attendance policy will shift next fall from a single college-wide "one size fits all" policy to an policy of letting instructor's set their own attendance policy. With this impending change, there is an interest in noting present attendance patterns. MS 150 Statistics meets for an hour a day Monday, Wednesday, and Friday.
| statistic | absences |
|---|---|
| sample size n | 56 |
| min | 0 |
| max | 16.5 |
| range | 16.5 |
| midrange | 8.25 |
| mode | 1.3 |
| median | 4.65 |
| mean | 5.4 |
| stdev | 4.12 |
| Correlation | -0.59 |
The above table represents 56 students who range from perfect attendance (0 absences) to 16.5 absences with a mean of 5.40 absences.
In my courses a late is a third of an absence. Since I run attendance as a point per day, a third of an absence would be "0.6666..." Thus I actually enter "0.7" making a late technically 30% of an absence. Extremely late (arriving half way through the period) causes a reduction to 50% of a point, hence the fractional mode and median.
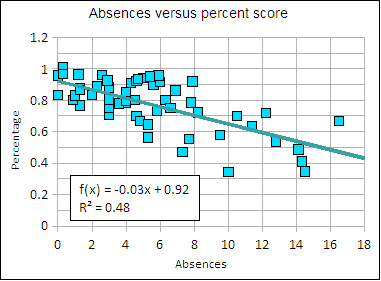
Increasing number of absences is negatively correlated with performance, prior to administering the final examination the correlation r was -0.62, a moderate to moderately strong negative correlation. The higher the numer of absences, the lower the student's percentage (points) in the course. The linear regression suggests a loss of 3% in overall score per absence. The final examination decreased the correlation slightly to -0.59. The correlation is statistically significant.

Linear regression trend line attendance versus performance in course
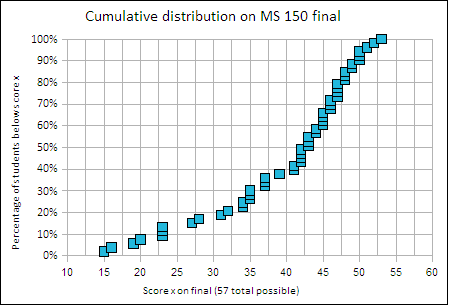
The final examination score distribution provides another view of student comprehension of material in statistics. The fifty question final ranges from basic statistics to making inferences based on p-values for two samples. The following chart shows the distribution of the student papers as a function of the student's score. There were 57 points possible on 50 questions, no student attained more than 53 points.

Cumulative grade distribution
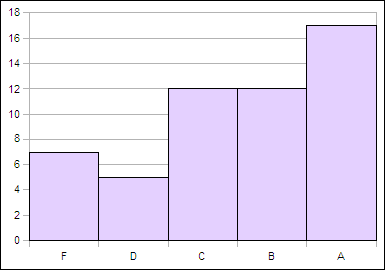
Although not a direct assessment of learning, grade distributions do have meaning when coupled with in-course assessment that is aligned with the student learning outcomes on the outline. Questions on in-course quizzes and tests consist of questions that can each be mapped back to a student learning outcome on the outline. The bulk of the questions are valued at one point, with certain multiple-entry tables and charts being worth up to five points. Grades are then calculated from the points attained. While this is not matrix-level assessment which permits one to say, "Johnny can do x," I would argue the result is grades that have underlying meaning in terms of student learning. The course grade distribution is shown in the following chart.

Grade distribution