t2 mx sc1 5.3 Statistics Φ Name:

| FL | FiboBelly ratio |
|---|
| AS | 1.600 |
| YW | 1.636 |
| HP | 1.655 |
| CH | 1.655 |
| LR | 1.690 |
| LN | 1.714 |
| GS | 1.714 |
| AG | 1.720 |
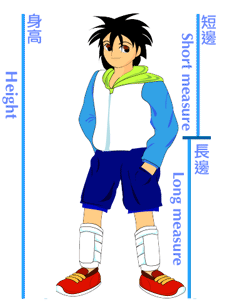
The FiboBelly ratio is the ratio of your height in centimeters divided by the height of your belly button (your height divided by the long measure in the diagram). A well circulated myth is that this ratio is, on average, the golden ratio Φ =
. Retain four face digits in your answers! Enter data carefully, double check your data entry!
- __________ What level of measurement is the data?
- __________ Calculate the sample size n for the data.
- __________ Determine the minimum.
- __________ Determine the maximum.
- __________ Calculate the range.
- __________ Calculate the midrange.
- __________ Determine the mode.
- __________ Determine the median.
- __________ Calculate the sample mean x.
- __________ Calculate the standard deviation sx.
- __________ Calculate the sample coefficient of variation CV.
- __________ If this data were to be divided into three classes, what would be the width of a single class?
-
Determine the frequency and calculate the relative frequency using three classes.
Record your results in the table provided.
| FiboBelly CUL (m) | Frequency (f) | Relative Frequency p(x) |
|---|
| | |
| | |
| | |
| Sum: | | |
- Sketch a frequency histogram chart of the data anywhere it fits,
labeling your horizontal axis and vertical axis as appropriate.
- ____________________ What is the shape of the distribution?
- __________ Use the sample mean x and standard deviation sx
calculated above to determine the z-score for Shanalin's fibobelly ratio of 2.036.
- ____________________ Is the z-score for a fibobelly ratio 2.036 an ordinary or unusual z-score?
- __________ What is the probabity that a fibobelly ratio is greater than 1.68?
- __________ What is the probability of rolling a four or a multiple of four on a twelve sided die numbered one to twelve?
-
| Name | FiboBelly ratio | Height |
|---|
| Dana | 1.619 | 67 |
| Marlin | 1.721 | 58.5 |
| Tristan | 1.850 | 37 |
The table contains fibobelly data verus height data for three individuals.
_________ Calculate the sample size n.
- _________ Calculate the slope of the linear regression.
- _________ Calculate the y-intercept of the linear regression.
- _________ Is the relationship positive, negative, or neutral?
- _________ Calculate the correlation coefficient r for the data.
- ______________ Is the correlation none, weak/low, moderate, strong/high, or perfect?
- _________ Determine the coefficient of determination.
- _________ What percent in the variation in the fibobelly ratio "explains" the variation in height?
- _________ Use the slope and intercept to predict the height for a fibobelly ratio of 1.800
- _________ Use the slope and intercept to predict the fibobelly ratio for a height of 50 inches.
Note: The relationship above is not statistically significant - the sample size is far too small. Over a larger sample the variables relate randomly at a given age. For the purposes of this test the sample size was kept small.

