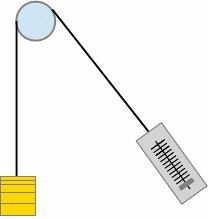
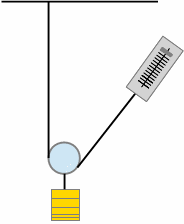
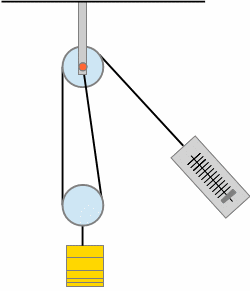
042 • • Name:
- Plot the data in the table on the graph.
- ______________ Use a spreadsheet function to calculate the slope of the line.
- ______________ Use a spreadsheet function to calculate the y-intercept of the line.
- ______________ Calculate the load that could be lifted by a force of 200 gmf.
- ______________ Calculate the force required to lift a load of 1600 gmf.
- Can this linear relationship be extended to any force or load? Why or why not?


