| Table One |
|---|
| Arrests in November |
|---|
| Citation | Frequency |
|---|
| Public intoxication | 27 |
| Breaking and entering | 9 |
| Assault and battery | 9 |
| Slow driving | 0 |
Quiz 01 2.2 • Name:
Table one is data from the Phyctitious Police Department.
- ____________________ Determine the level of measurement for the data in table one.
- __________ Calculate the sample size n for table one.
- __________ Determine the mode for the data in table one.

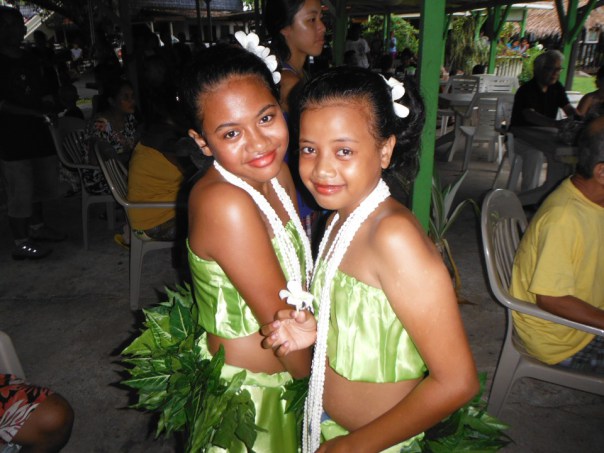
Kapinga Pride
| Table two |
|---|
| Dance group | Score |
|---|
| Beauty Cousins Madolehnihmw | 101 |
| Bring it on Girls Pohnlik | 126 |
| G-Babes Meitik | 102 |
| Gangsta 2nd group | 55 |
| Gangsta Boys 5 | 80 |
| Gangsta Meitik | 82 |
| Kapinga pride | 103 |
| Ohnonlong Wone | 99 |
| Sista Sista Ohmine | 105 |
| Young roses Paliais | 113 |
For the following questions, use only the score column in table two. The data is from a dance contest.
- ____________________ Determine the level of measurement.
- __________ Calculate the sample size n.
- __________ Calculate the mode.
- __________ Calculate the median.
- __________ Calculate the sample mean x.
- __________ Calculate the minimum.
- __________ Calculate the maximum.
- __________ Calculate the first quartile.
- __________ Calculate the third quartile.
- __________ Calculate the InterQuartile Range.
- Make a sketch of the box plot including labeled axes and outliers.
- Which group has a score that is an outlier?

