Original document privately held in Schoology
Students in SC 130 Physical Science were measuring bars of Dial Soap and obtained the following data:
1
On a penny with a head and a tail, what is the probability of heads prior to tossing the coin?

2
On a six sided die numbered from one to six, what is the probability of rolling a three?

3
While out on a five kilometer run on Wednesday evening I kept track of the make of the cars using a scrap pad of paper and a pen. I recorded each manufacturer for each car I saw on the road during my 41 minute run. During the run I made hash marks |||| next to manufacturer names. When I returned home I tallied up the counts from the run and made the following table:

Manufacturer	Frequency	Relative Freq
Toyota	90	30%
Nissan	51	17%
Mazda	42	14%
Honda	36	12%
Mitsubishi	32	11%
Suzuki	14	5%
Hyundai	12	4%
Ford	7	2%
Kia	6	2%
Isuzu	5	2%
BMW	2	1%
Daihatsu	1	0%
AMC Jeep	1	0%
Mercedes Benz	1	0%
300	1
For this data, what is the level of measurement?
Multiple Choice - 0 points

4
For the automobile manufacturer data above, the sample size n is _
Fill in the Blank - 2 points

5
For the automobile manufacturer data above, the mode is _
Fill in the Blank - 2 points

6
Based on the automobile sample above, what is the probability that a car on the roads of Pohnpei is a Toyota? _ (Your answer can be a percent with a percent sign or a two decimal place decimal value using a decimal point)
Fill in the Blank - 2 points

7
Kia and Hyundai cars are made in South Korea. Based on the automobile sample above, what is the probability that a car on the roads of Pohnpei is made in South Korea? _ (Your answer can be a percent with a percent sign or a two decimal place decimal value using a decimal point)
Fill in the Blank - 2 points

8
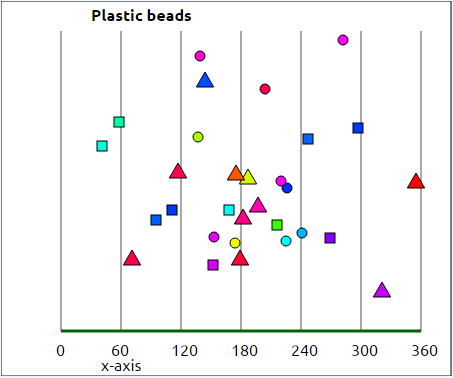
Plastic beads were thrown into the air and fell on the floor in the pattern seen in the following image. The horizontal distribution is in centimeters marked along the x-axis. What is the best estimate for the horizontal mean for this plastic bead distribution?

9
Plastic beads were thrown into the air and fell on the floor in the pattern seen in the following image. The horizontal distribution is in centimeters marked along the x-axis. What is the best estimate for the horizontal standard deviation for this plastic bead distribution?

10
Based on a histogram, does the horizontal bead distribution appear to be roughly a normal distribution?