Slovakia
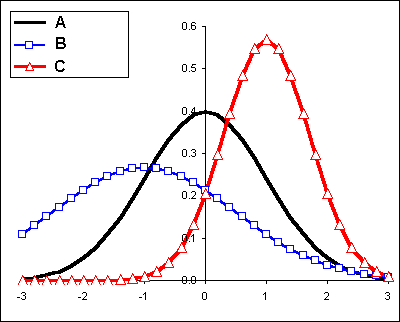
- The diagram below depicts three normal curves

- Which curve has the smallest mean? _______
- Which curve has the smallest standard deviation? _______
- What is the mean for curve A? _______
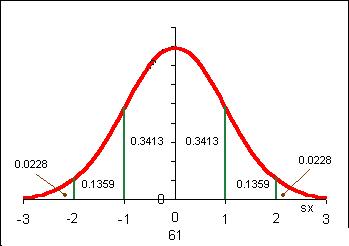
- I run home in a mean time m = 61 minutes with a standard
deviation s of 7 minutes. My times are normally distributed
about the mean.

- What is the probability that a run will take less than 61 minutes? _______
- What is the probability that a run will take more than 68 minutes? _______
- If I run 50 runs home during 2001, how many runs would be expected to last between 54
minutes and 68 minutes? _______
Lee Ling home COM-FSM home page

