The sequence of required mathematics courses at the College of Micronesia-FSM has proven challenging for students at the College. The low rates of success in mathematics courses has meant that the mathematics sequence acts as a gateway to graduation, or, for some students, a barrier to eventual graduation.
In the early 1990's the Department of Natural Science and Mathematics wanted to implement computer based instructional technologies in order to attempt to impact the rate of student success in the mathematics courses. Neither the Department nor the College had the financial capacity to implement such programs. A United States Department of Education Title III Grant that began in 1995 and the Congress of the Federated States of Micronesia provided the support and facilities necessary to implement computer assisted instruction at the College.
Over the past five years studies have looked at individual courses at the College and the impact changes in curriculum and technology have had in those courses. This report looks at student success rates in the mathematics core over the past five years.
The core mathematics sequence at the College consists of the following courses:
Students are promoted to the next course if they receive an A, B, or C. Students receiving a mark of D, F, or W (withdrawal) must repeat the course if they intend to or are required to take the next higher math course in the sequence.
The following table details the promotion rate in the above mathematics courses from Spring 1995 to Spring 2000.
| Term and Year | Number of Students Retained |
Number of Students Promoted to the next course |
Total Students |
Retained% | Promoted% |
|---|---|---|---|---|---|
| Spring 95 | 192 | 200 | 392 | 49% | 51% |
| Fall 95 | 290 | 274 | 564 | 51% | 49% |
| Spring 96 | 294 | 173 | 467 | 63% | 37% |
| Summer 96 | 50 | 96 | 146 | 34% | 66% |
| Fall 96 | 240 | 234 | 474 | 51% | 49% |
| Spring 97 | 243 | 160 | 403 | 60% | 40% |
| Summer 97 | 55 | 45 | 100 | 55% | 45% |
| Fall 97 | 276 | 250 | 526 | 52% | 48% |
| Spring 98 | 217 | 119 | 336 | 65% | 35% |
| Summer 98 | 39 | 75 | 114 | 34% | 66% |
| Fall 98 | 167 | 276 | 443 | 38% | 62% |
| Spring 99 | 174 | 181 | 355 | 49% | 51% |
| Summer 99 | 53 | 61 | 114 | 46% | 54% |
| Fall 99 | 185 | 233 | 418 | 44% | 56% |
| Spring 00 | 163 | 174 | 337 | 48% | 52% |
| Averages | 176 | 170.067 | 346 | 49% | 51% |
| pre1997 rates | 1066 | 977 | 2043 | 52% | 48% |
| 1997 to 1998 rates | 997 | 925 | 1922 | 52% | 48% |
| 1999 and 2000 rates | 575 | 649 | 1224 | 47% | 53% |
| slope/trend data | -7.17 | -2.2071 | -9.4 | -0.54% | 0.54% |
| standard deviation | 90 | 77 | 156 | 9.3% | 9.3% |
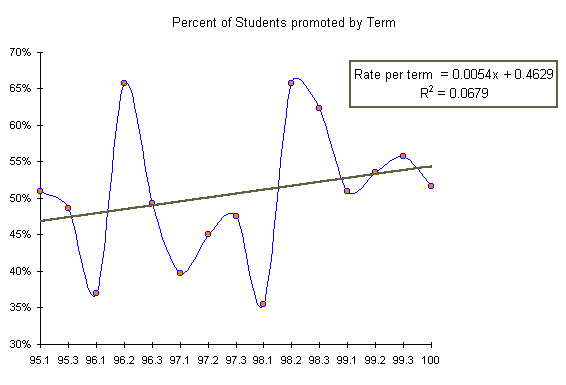
On average only half of the students in a math course in 1995 (51%) were promoted to the next course. Based on anecdotal evidence and casual surveys of gradebooks in the early nineties, this fifty-fifty split of students was the case through the nineteen-nineties and may have been the situation even earlier in the history of the College.
Over the course of the past five years the percentage of students obtaining results that allow for promotion to the next course has varied, but the average over the five year period has been a 51% promotion rate. The variation from term to term (Standard deviation = 9.3%) dwarfs the underlying positive trend in promotion rates (Trend = 0.54% per term). With such large term to term variations, the trend is sensitive to the results of a single term. A Summer 00 term with a promotion rate on the order of that seen in the Spring of 1998 (35%) could turn the trend negative.

The upward trend may also be an artifact of a differential in the mix of students in the courses. Note that the overall student population in math courses is falling by 9.4 students per term, but the loss is not evenly split between students who are promoted and those who do not rate promotion. The loss rate of promotable students is only 2.2 students, while the loss rate of students who are retained is 7.2 students. These 7.2 students are not students dropping out of the course - the data counts all students in course from the beginning of term. This differential represents, in some sense, a shift in the makeup of student abilities. This shift may be meaningless - there are large term to term variations in the student population in math courses. Or the shift may represent slightly better preparation and promotion practices occurring at the College. Either way, the shift could account for the nominal positive change in promotion rates.
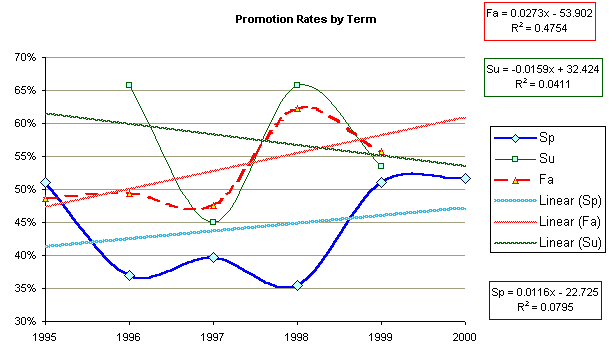
Use of the computer laboratory software occurred primarily during the Fall and Spring terms. There is also a sense in the Department that students tend to do better in math courses during the summer session when students typically take fewer courses. Thus there might be difference in success rate improvement when the data is considered by season.
The following table examines the same data separated by term.
| Spring | Summer | Fall | Averages | |
|---|---|---|---|---|
| 1995 | 51% | 49% | 50% | |
| 1996 | 37% | 66% | 49% | 51% |
| 1997 | 40% | 45% | 48% | 44% |
| 1998 | 35% | 66% | 62% | 55% |
| 1999 | 51% | 54% | 56% | 53% |
| 2000 | 52% | 52% | ||
| average: | 44% | 58% | 53% | 51% |
| standard deviation: | 7.70% | 10.15% | 6.25% | 3.67% |
| slope/trends: | 1.16% | -1.59% | 2.73% | 0.79% |
Summer term does see higher rates of promotion to the next course, but with a negative trend in the summer promotion rates over time. Both Fall and Spring have small positive trends in the promotion rate per year. Note that in the above table the trends are on an annual basis so the overall trend of 0.79% is different from the first data set which worked the trend on a per term basis. With large standard deviations and dozens of confounding factors, the laboratory cannot claim to be underlying the small positive trend in promotion rates in the Fall and the Spring. Still, the difference in the trend directions for the computer supported terms (Fall and Spring) versus the unsupported term (Summer) suggests the possibility that the laboratory and the computers have been a factor in slightly increased promotion rates.

Due in part to the large variations in the above data, the data was broken out by individual instructor to control for variations in grading between instructors. The thought was that the variation in the above sets of data is due to different grading standards and trends with each instructor. Only Full-Time instructors and only the Fall and Spring terms were examined. As seen in the table below, the instructors have widely varying rates of promotion over time. The variability in the data cannot be controlled by controlling for instructor.
| Sp95 | Fa95 | Sp96 | Fa96 | Sp97 | Fa97 | Sp98 | Fa98 | Sp99 | Fa99 | Sp00 | Avg | Slope | StDev | |
|---|---|---|---|---|---|---|---|---|---|---|---|---|---|---|
Inst #1 |
40% | 26% | 56% | 33% | 39% | 0.08% | 13% | |||||||
Inst #2 |
43% | 30% | 39% | 37% | -3.73% | 7% | ||||||||
Inst #3 |
35% | 40% | 58% | 38% | 49% | 31% | 39% | 47% | 52% | 43% | 1.25% | 9% | ||
Inst #4 |
36% | 33% | 35% | 60% | 33% | 52% | 34% | 40% | 2.02% | 11% | ||||
Inst #5 |
56% | 40% | 37% | 44% | -13.50% | 10% | ||||||||
Inst #6 |
51% | 43% | 35% | 36% | 41% | -10.92% | 8% | |||||||
Inst #7 |
66% | 61% | 44% | 30% | 54% | 51% | -4.28% | 14% | ||||||
Inst #8 |
50% | 57% | 41% | 41% | 83% | 55% | 15.56% | 17% | ||||||
Inst #9 |
28% | 55% | 47% | 45% | 45% | 44% | 4.83% | 10% | ||||||
Inst #10 |
73% | 49% | 47% | 54% | 56% | -12.04% | 12% | |||||||
Inst #11 |
60% | 86% | 63% | 70% | 3.94% | 15% | ||||||||
| Avgs | 43% | 44% | 39% | 50% | 41% | 44% | 41% | 53% | 49% | 56% | 54% | 47% | -1.53% | 11% |
Slope of the averages in the bottom row: 2.50%. The -1.53% in the bottom of the slope column is the average of the slopes above.
Overall, the five year promotion rates in core mathematics courses at the College of
Micronesia-FSM remain near 50% with little sign of significant improvement during this
time frame. There is no strong signal that computing technologies and attendant revised
curricula impacted student promotion rates in the core math courses.
One of the activity coordinators noted in 1997 that the computers were to mathematics what a microscope is to biology. Microscopes in and of themselves do not cause students to get better grades. Microscopes expand the material that can be explored and directly accessed by students. Adding microscopes to a biology course that has not previously used microscopes might see grades go down as the microscope bring new skills to be mastered and new material to be learned to the course. The computer and it's software is a mathematical microscope, allowing students to explore concepts in ways they could not do previously. The computer opens up new horizons and possibilities, especially in the Department's initial choice to use mathematical "engine" software.
The software itself continues to impact and change the curricula and what instructors choose to teach in their courses.
The software is also opening the possibility of providing support from the national campus to the state campuses as the package can create modules that be accessed by an Internet browser. A small piece of free software called a "plug-in" is all the remote user needs to access and interact with the material. This option only became fully realizable in the most recent edition of the software. This capacity provides for real-time collaboration possibilities between the campuses and for the dissemination of support material system-wide.
In the Fall of 1996 an experimental curriculum was implemented in PreAlgebra. This curriculum differed radically from the curriculum at that time. The students who successfully completed the course in the Fall of 1996 had a statistically significant higher rate of promotion out of the next class, Transition to Algebra. Yet in the Fall 1996 PreAlgebra class itself the promotion rate was not different from that of a control group in the traditional curriculum. The factors that contribute to a low rate of promotion to the next course appear to exist external to the choice of curricula or computer assisted support packages.
Understanding the factors that actually cause the low rates of promotion are an obvious next task. The work over the past five years provides an important set of null results that have been necessary in order to make progress in the future. The results of the past five years have led to better and clearer insights into what next steps make the most sense to pursue.